


Introduction
With the rising use of the Internet in today’s society, the quantity of data created is incomprehensibly huge. Even though the nature of individual data is straightforward, the sheer amount of data to be analyzed makes processing difficult for even computers.
To manage such procedures, we need large data analysis tools. Data mining methods and techniques, in conjunction with machine learning, enable us to analyze large amounts of data in an intelligible manner. k-means is a technique for data clustering that may be used for unsupervised machine learning. It is capable of classifying unlabeled data into a predetermined number of clusters based on similarities (k).
Introduction to K-Means Algorithm
The K-means clustering algorithm computes centroids and repeats until the optimal centroid is found. It is presumptively known how many clusters there are. It is also known as the flat clustering algorithm. The number of clusters found from data by the method is denoted by the letter ‘K’ in K-means.
In this method, data points are assigned to clusters in such a way that the sum of the squared distances between the data points and the centroid is as small as possible. It is essential to note that reduced diversity within clusters leads to more identical data points within the same cluster.
Working of K-Means Algorithm
The following stages will help us understand how the K-Means clustering technique works-
- Step 1: First, we need to provide the number of clusters, K, that need to be generated by this algorithm.
- Step 2: Next, choose K data points at random and assign each to a cluster. Briefly, categorize the data based on the number of data points.
- Step 3: The cluster centroids will now be computed.
- Step 4: Iterate the steps below until we find the ideal centroid, which is the assigning of data points to clusters that do not vary.
- 4.1 The sum of squared distances between data points and centroids would be calculated first.
- 4.2 At this point, we need to allocate each data point to the cluster that is closest to the others (centroid).
- 4.3 Finally, compute the centroids for the clusters by averaging all of the cluster’s data points.
K-means implements the Expectation-Maximization strategy to solve the problem. The Expectation-step is used to assign data points to the nearest cluster, and the Maximization-step is used to compute the centroid of each cluster.
When using the K-means algorithm, we must keep the following points in mind:
- It is suggested to normalize the data while dealing with clustering algorithms such as K-Means since such algorithms employ distance-based measurement to identify the similarity between data points.
- Because of the iterative nature of K-Means and the random initialization of centroids, K-Means may become stuck in a local optimum and fail to converge to the global optimum. As a result, it is advised to employ distinct centroids’ initializations.
Implementation of K Means Clustering Graphical Form
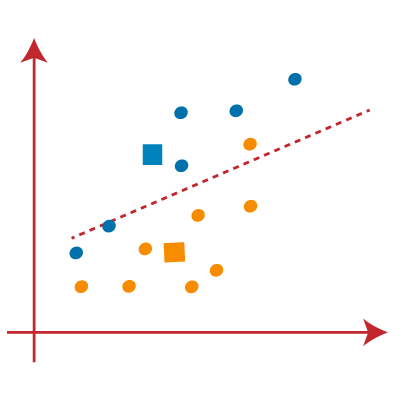
STEP 1: Let us pick k clusters, i.e., K=2, to separate the dataset and assign it to its appropriate clusters. We will select two random places to function as the cluster’s centroid.
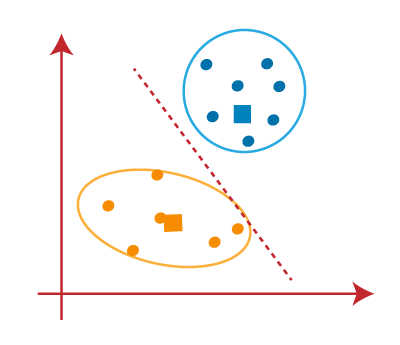
STEP 2: Now, each data point will be assigned to a scatter plot depending on its distance from the nearest K-point or centroid. This will be accomplished by establishing a median between both centroids. Consider the following illustration:
STEP 3: The points on the line’s left side are close to the blue centroid, while the points on the line’s right side are close to the yellow centroid. The left Form cluster has a blue centroid, whereas the right Form cluster has a yellow centroid.
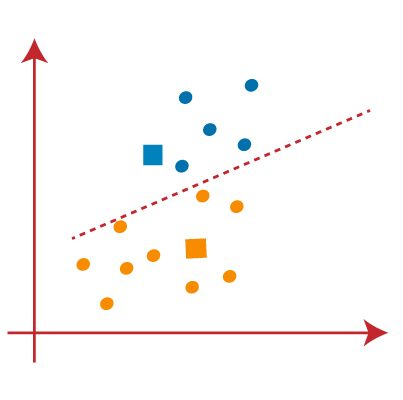
STEP 4: Repeat the procedure, this time selecting a different centroid. To choose the new centroids, we will determine their new center of gravity, which is represented below:
STEP 5: After that, we’ll re-assign each data point to its new centroid. We shall repeat the procedure outlined before (using a median line). The blue cluster will contain the yellow data point on the blue side of the median line.
STEP 6: Now that reassignment has occurred, we will repeat the previous step of locating new centroids.
STEP 7: We will repeat the procedure outlined above for determining the center of gravity of centroids, as shown below.
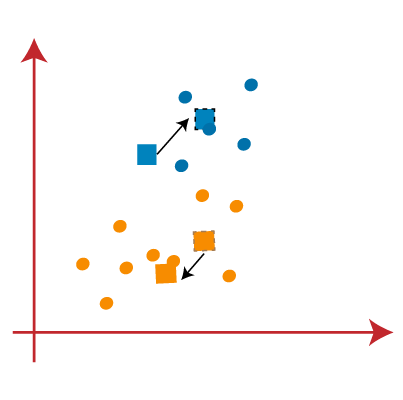
STEP 8: Similar to the previous stages, we will draw the median line and reassign the data points after locating the new centroids.
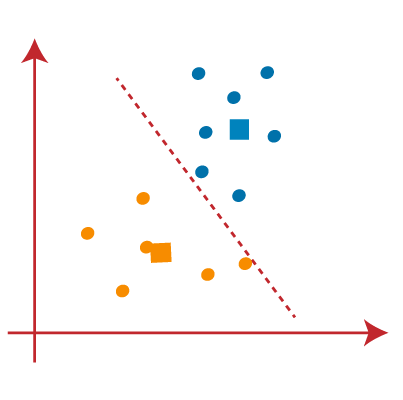
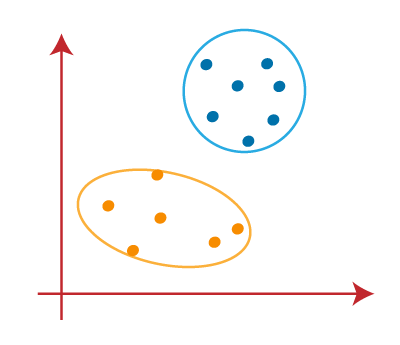
STEP 9: We will finally group points depending on their distance from the median line, ensuring that two distinct groups are established and that no dissimilar points are included in a single group.
The final Cluster is as follows:
Implementation in Python
To further understand K-Means clustering, let’s look at two real-world situations.
Example 1
This is a simple example of how k-means works. In this example, we will first construct a 2D dataset with four distinct blobs and then use the k-means algorithm to observe the results.
To begin, we will import the essential packages.
%matplotlib inline
import matplotlib.pyplot as plt
import seaborn as sns; sns.set()
import numpy as np
from sklearn.cluster import KMeans
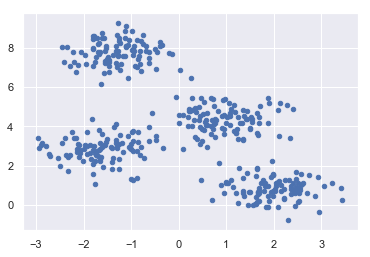
The code below will build a 2D dataset with four blobs.
from sklearn.datasets.samples_generator import make_blobs
X, y_true = make_blobs(n_samples=400, centers=4, cluster_std=0.60, random_state=0)
Following that, the code below will assist us in visualizing the dataset.
plt.scatter(X[:, 0], X[:, 1], s=20);
plt.show()
Next, create a K – means object while specifying the number of clusters, train the model, and estimate as follows-
kmeans = KMeans(n_clusters=4)
kmeans.fit(X)
y_kmeans = kmeans.predict(X)
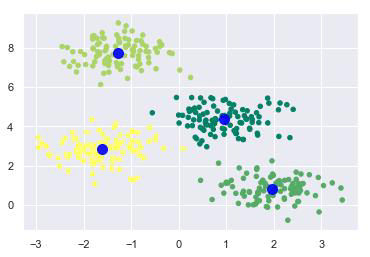
Now, using the code below, we can plot and visualize the cluster’s centers as determined by the k-means Python estimator-
plt.scatter(X[:, 0], X[:, 1], c=y_kmeans, s=20, cmap='summer')
centers = kmeans.cluster_centers_
plt.scatter(centers[:, 0], centers[:, 1], c='blue', s=100, alpha=0.9);
plt.show()
Example 2
Consider another example in which we will use K-means clustering on a simple digit’s dataset. Without relying on the original label information, K-means will try to identify numbers that are similar.
To begin, we will import the essential packages-
%matplotlib inline
import matplotlib.pyplot as plt
import seaborn as sns; sns.set()
import numpy as np
from sklearn.cluster import KMeans
Load the digit dataset from sklearn and create an object out of it. Additionally, we can get the total number of rows and the total number of columns in this dataset by doing the following:
from sklearn.datasets import load_digits
digits = load_digits()
digits.data.shape
Output
(1797, 64)
According to the result, this dataset has 1797 samples with 64 features.
We may cluster the data in the same way that we did in Example 1 above.
kmeans = KMeans(n_clusters=10, random_state=0)
clusters = kmeans.fit_predict(digits.data)
kmeans.cluster_centers_.shape
Output
(10, 64)
The output above indicates that K-means generated 10 clusters with 64 features.
fig, ax = plt.subplots(2, 5, figsize=(8, 3))
centers = kmeans.cluster_centers_.reshape(10, 8, 8)
for axi, center in zip(ax.flat, centers):
   axi.set(xticks=[], yticks=[])
   axi.imshow(center, interpolation='nearest', cmap=plt.cm.binary)
Output
As a result, we will receive the picture below, which shows clusters centers learned by k-means.
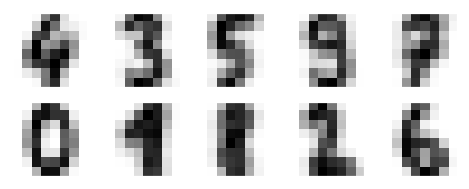
Image
The code below will match the learned cluster labels with the actual labels found in them.
from scipy.stats import mode
labels = np.zeros_like(clusters)
for i in range(10):
   mask = (clusters == i)
   labels[mask] = mode(digits.target[mask])[0]
Following that, we can check the accuracy as follows:
from sklearn.metrics import accuracy_score
accuracy_score(digits.target, labels)
Output
0.7935447968836951
The above output indicates that the accuracy is roughly 80%.
K-Means Clustering Algorithm Applications
The performance of K-means clustering is sufficient to achieve the given goals. When it comes to the following scenarios, it is useful:
- To get relevant insights from the data we’re dealing with.
- Distinct models will be created for different subgroups in a cluster-then-predict approach.
- Market segmentation
- Document Clustering
- Image segmentation
- Image compression
- Customer segmentation
- Analyzing the trend on dynamic data
Advantages and Disadvantages
Advantages
The below are some of the features of K-Means clustering algorithms:
- It is simple to grasp and put into practice.
- K-means would be faster than Hierarchical clustering if we had a high number of variables.
- An instance’s cluster can be changed when centroids are re-computation.
- When compared to Hierarchical clustering, K-means produces tighter clusters.
Disadvantages
Some of the drawbacks of K-Means clustering techniques are as follows:
- The number of clusters, i.e., the value of k, is difficult to estimate.
- A major effect on output is exerted by initial inputs such as the number of clusters in a network (value of k).
- The sequence in which the data is entered has a considerable impact on the final output.
- It’s quite sensitive to rescaling. If we rescale our data using normalization or standards, the outcome will be drastically different. ultimate result
- It is not advisable to do clustering tasks if the clusters have a sophisticated geometric shape.
Conclusion
Every machine learning engineer wants their algorithms to make accurate predictions. These sorts of learning algorithms are often classified as supervised or unsupervised. K-means clustering is an unsupervised technique that requires no labeled response for the given input data.
K-means clustering is a widely used approach for clustering. Generally, practitioners begin by learning about the architecture of the dataset. K-means clusters data points into unique, non-overlapping groupings. It works very well when the clusters have a spherical form. However, it suffers from the fact that clusters’ geometric forms depart from spherical shapes.
Additionally, it does not learn the number of clusters from the data and needs that it be stated beforehand. It’s always beneficial to understand the assumptions behind algorithms/methods in order to have a better understanding of each technique’s strengths and drawbacks. This will assist you in determining when and under what conditions to utilize each form.
I hope you find the information interesting. If you’d want to communicate with me, you may do so via:
Linkedin or if you have any other questions, you can also drop me an email.
Currently, I Am pursuing my Bachelors of Technology( B.Tech) from Vellore Institute of Technology. I am very enthusiastic about programming and its real applications including software development, machine learning and data science.