Introduction
The term “Big Data” is a bit of a misnomer since it implies that pre-existing data is somehow small (it isn’t) or that the only challenge is its sheer size (size is one of them, but there are often more). In short, the term Big Data applies to information that can’t be processed or analyzed using traditional processes or tools. In this article, we look into the concept of big data and what it is all about. We will also explore the three main characteristics of big data in detail.

Increasingly, organizations today are facing more and more Big Data challenges. They have access to a wealth of information, but they don’t know how to get value out of it because it is sitting in its most raw form or in a semi-structured or unstructured format. As a result, they don’t even know whether it’s worth keeping (or even able to keep it, for that matter). Big Data platforms come with solutions for these issues.
Learning Objectives:
- Learn what Big Data is and how it is relevant in today’s world.
- Get to know the characteristics of Big Data.
Table of contents
What Is Big Data?
An IBM survey found that over half of the business leaders, today realize they don’t have access to the insights they need to do their jobs. Companies are facing these challenges in a climate where they have the ability to store anything, and they are generating data like never before in history; combined, this presents a real information challenge.

It’s a conundrum: today’s business has more access to potential insight than ever before, yet as this potential gold mine of data piles up, the percentage of data the business can process is going down—fast. Quite simply, the Big Data era is in full force today because the world is changing.
Through instrumentation, we’re able to sense more things, and if we can sense it, we tend to try and store it (or at least some of it). Through advances in communications technology, people and things are becoming increasingly interconnected—and not just some of the time, but all of the time. This interconnectivity rate is a runaway train. Generally referred to as machine-to-machine (M2M), interconnectivity is responsible for double-digit year-over-year (YoY) data growth rates.
An Example of the Application of Big Data
Since small integrated circuits are now so inexpensive, we’re able to add intelligence to almost everything. Even something as mundane as a railway car has hundreds of sensors. On a railway car, these sensors track such things as the conditions experienced by the rail car, the state of individual parts, and GPS-based data for shipment tracking and logistics. After train derailments claimed extensive losses of life, governments introduced regulations to store and analyze this kind of data to prevent future disasters.
Rail cars are also becoming more intelligent. Processors on trains can now interpret sensor data on parts prone to wear, such as bearings, to identify parts that need repair before they fail and cause further damage—or worse, disaster. But it’s not just the rail cars that are intelligent—the actual rails have sensors every few feet. Moreover, the data storage requirements are for the whole ecosystem: cars, rails, railroad crossing sensors, weather patterns that cause rail movements, etc.
Now add this to tracking a rail car’s cargo load and arrival and departure times, and you can very quickly see you have a Big Data problem. Even if every bit of this data was relational (and it’s not), it would all be raw and have very different formats, making processing it in a traditional relational system impractical or impossible. Rail cars are just one example, but we see domains with velocity, volume, and variety combining to create the Big Data problem everywhere we look.
What Are the Characteristics of Big Data?
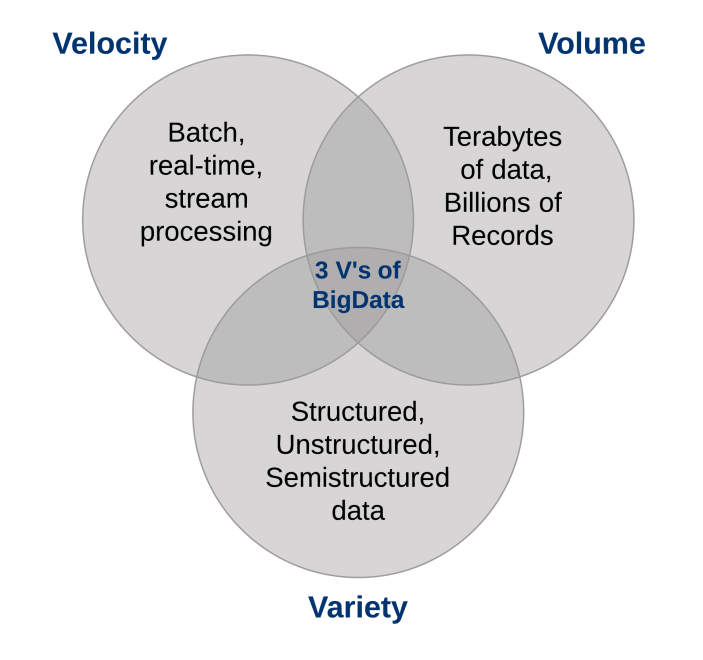
Three characteristics define Big Data: volume, variety, and velocity.
Together, these characteristics define “Big Data”. They have created the need for a new class of capabilities to augment the way things happen today. This provides a better line of sight and control over our existing knowledge domains and the ability to act on them.

1. The Volume of Data
The sheer volume of data being stored today is exploding. In the year 2000, 800,000 petabytes (PB) of data were stored in the world. Of course, a lot of the data that’s being created today isn’t analyzed at all, and that’s another problem that needs to be considered. This number is expected to reach 35 zettabytes (ZB) by 2020. Twitter alone generates more than 7 terabytes (TB) of data every day, Facebook 10 TB, and some enterprises generate terabytes of data every hour of every day of the year. It’s no longer unheard of for individual enterprises to have storage clusters holding petabytes of data.
When you stop and think about it, it’s a little wonder we’re drowning in data. We store everything: environmental data, financial data, medical data, surveillance data, and the list goes on and on. For example, taking your smartphone out of your holster generates an event; when your commuter train’s door opens for boarding, that’s an event; check-in for a plane, badge into work, buy a song on iTunes, change the TV channel, take an electronic toll route—every one of these actions generates data.
Okay, you get the point: There’s more data than ever before, and all you have to do is look at the terabyte penetration rate for personal home computers as the telltale sign. We used to keep a list of all the data warehouses we knew that surpassed a terabyte almost a decade ago—suffice to say, things have changed when it comes to volume.
Big Data Platforms Can Deal With Large Volumes of Data
As implied by the term “Big Data,” organizations are facing massive volumes of data. Organizations that don’t know how to manage this data are overwhelmed by it. But the opportunity exists, with the right technology platform, to analyze almost all of the data (or at least more of it by identifying the data that’s useful to you) to gain a better understanding of your business, your customers, and the marketplace. And this leads to the current conundrum facing today’s businesses across all industries.
As the amount of data available to the enterprise is on the rise, the percentage of data it can process, understand, and analyze is on the decline, thereby creating the blind zone.
What’s in that blind zone?
You don’t know: it might be something great or maybe nothing at all, but the “don’t know” is the problem (or the opportunity, depending on how you look at it). The conversation about data volumes has changed from terabytes to petabytes with an inevitable shift to zettabytes, and all this data can’t be stored in your traditional systems.
2. The Variety of Data
The volume associated with the Big Data phenomena brings along new challenges for data centers trying to deal with it: its variety.
With the explosion of sensors, smart devices, and social collaboration technologies, data in an enterprise has become complex. It includes traditional relational data as well as raw, semi-structured data. It also includes unstructured data from web pages, weblog files (including click-stream data), search indexes, social media forums, e-mail, documents, sensor data from active and passive systems, etc.
Moreover, traditional systems can struggle to store and perform the required analytics to gain an understanding of the contents of these logs. This is because much of the information being generated doesn’t lend itself to traditional database technologies. In my experience, although some companies are moving down the path, by and large, most are just beginning to understand the opportunities of Big Data.
Quite simply, variety represents all types of data—a fundamental shift in analysis requirements from traditional structured data to include raw, semi-structured, and unstructured data as part of the decision-making and insight process. Traditional analytic platforms can’t handle variety. However, an organization’s success will rely on its ability to draw insights from the various kinds of data available to it, which includes both traditional and non-traditional.
Big Data Platforms Can Handle a Variety of Data
When we look back at our database careers, sometimes it’s humbling to see that we spent more of our time on just 20 percent of the data: the relational kind that’s neatly formatted and fits ever so nicely into our strict schemas. But the truth of the matter is that 80 percent of the world’s data (and more and more of this data is responsible for setting new velocity and volume records) is unstructured or semi-structured at best. If you look at a Twitter feed, you’ll see structure in its JSON format—but the actual text is not structured, and understanding that can be rewarding.
Video and picture images aren’t easily or efficiently stored in a relational database. Certain event information can dynamically change (such as weather patterns), which isn’t well suited for strict schemas, and more. To capitalize on the Big Data opportunity, enterprises must be able to analyze all types of data, both relational and non-relational: text, sensor data, audio, video, transactional, and more.
3. The Velocity of Data
Just as the sheer volume and variety of data we collect and the store has changed, so, too, has the velocity at which it is generated and needs to be handled. A conventional understanding of velocity typically considers how quickly the data is arriving and stored and its associated rates of retrieval. While managing all of that quickly is good—and the volumes of data that we are looking at are a consequence of how quickly the data arrives.
To accommodate velocity, a new way of thinking about a problem must start at the inception point of the data. Rather than confining the idea of velocity to the growth rates associated with your data repositories, we suggest you apply this definition to data in motion: The speed at which the data is flowing.

After all, we’re in agreement that today’s enterprises are dealing with petabytes of data instead of terabytes, and the increase in RFID sensors and other information streams has led to a constant flow of data at a pace that has made it impossible for traditional systems to handle. Sometimes, getting an edge over your competition can mean identifying a trend, problem, or opportunity only seconds, or even microseconds, before someone else.
Big Data and the Velocity of Data
More and more of the data being produced today has a very short shelf-life, so organizations must be able to analyze this data in near real-time if they hope to find insights into this data. In traditional processing, you can think of running queries against relatively static data: for example, the query “Show me all people living in the ABC flood zone” would result in a single result set to be used as a warning list of an incoming weather pattern. With stream computing, you can execute a process similar to a continuous query that identifies people who are currently “in the ABC flood zones,” but you get continuously updated results because location information from GPS data is refreshed in real-time.
Dealing effectively with Big Data requires that you perform analytics against the volume and variety of data while it is still in motion, not just after it is at rest. Consider examples from tracking neonatal health to financial markets; in every case, they require handling the volume and variety of data in new ways.
Conclusion
You can’t afford to sift through all the data that’s available to you in your traditional processes. It’s just too much data with too little known value and too much of a gambled cost. Big Data platforms allow you to economically store and process all that data and discover what’s valuable and worth exploiting. Moreover, since we talk about analytics for data at rest and data in motion, the actual data from which you can find value is not only broader, but you can use and analyze it more quickly in real-time.
I recommend you go through these articles to get acquainted with tools for big data-
- Getting Started with Apache Hive – A Must Know Tool For all Big Data and Data Engineering Professionals
- Introduction to the Hadoop Ecosystem for Big Data and Data Engineering
- PySpark for Beginners – Take your First Steps into Big Data Analytics (with Code)
Key Takeaways:
- The three characteristics that define Big Data are volume, variety, and velocity.
- Big Data, therefore, is defined as ‘data that contains a great variety and arrives in increasing volumes and velocities.’
Frequently Asked Questions
A. The three characteristics that define Big Data are volume, variety, and velocity. Big Data, therefore, is defined as ‘data that contains a great variety and arrives in increasing volumes and velocities.’
A. Big data is used for creating, storing, analyzing, and managing large volumes of data that cannot be stored or processed in traditional ways.
A. The three types of big data are structured, semi-structured, and unstructured.


