Introduction
Data science is a powerful tool and has the ability to transform the world. We are already seeing massive changes to the way industries work in the Western world and data science is powering that change.
But when it comes to India, we are still a long, long way from reaching that stage. As Dr. Avik mentioned in his insightful DataHack Radio podcast, most of the data we collect is highly unstructured and difficult to make sense of. But optimism abounds – there is a growing expectation that people are realizing how crucial data is to the economy.
In this article, we look at the top sectors in this wonderful nation of ours that are ripe for applying data science. We have also provided resource links for each sector with the hope that our AV community can take up the challenge and make this country a better place, all with the help of data science!
Tables of Contents
- Agriculture
- Electricity
- Water
- Healthcare
- Education
- Traffic/Road Accidents
- Air Pollution
Agriculture
The agriculture industry needs the use of data science more than any other right now. 40% of our population is employed in this field but unfortunately, agriculture’s contribution to the nation’s economy is a paltry 16% of the overall GPD. Given how critical this sector is, should that number not be significantly higher?
There are a lot of facets in agriculture that can be worked upon – predicting monthly/quarterly/annual yield, forecasting demand, analyzing weather patterns to decide when to sow, predicting the prices of vegetables so as to pick which crop to sow, etc.
Resources
Open datasets on agriculture: There are three datasets on this page – two are monthly and one is annual. These deal with the stock of different food grains in a year, the production of these food grains, and the central statistics of food and beverages.
Dataset on the crop production in India. It’s a fairly straightforward dataset but excellent for producing visualizations and basic insights.
Rainfall in India dataset. Another crucial aspect to agriculture, and one that decides the livelihood of farmers. Predicting rainfall is essential to farming, and with this dataset, you can do just that! It contains monthly rainfall data from 1901-2015.
This article, written by Shweta Gupta, is an excellent resource on the state of the agriculture industry in India, challenges that we face right now, and how we can use data to improve it. It should be a mandatory read for all Indians who are into data science, it’s just that important!
Electricity
The average electricity use in India during the 2016-17 FY was a staggering 1,122 kWh per capita. Out of this, the industrial consumption was 40%, followed by residential consumption at 24%. This is all to say that the power demand is surging beyond expectations as the population increases year-on-year.
Predicting power supply and demand, understanding the consumption pattern of households, classifying this by region/district/blocks, etc. are just some of the ways we can use data science in this sector. The resources I have mentioned below are enough to get you started and even go beyond that.
Resources
A collection of open datasets by the Government. Datasets on pattern of electricity consumption, per capita consumption, consumption by sectors, and more are available here. Check it out!
This Wikipedia article has up-to-date statistics on the electricity sector in India. This should be a compulsory read for all Indians, from students to working professionals. It is an eye opener to the fact that we are consuming power at a never-before-seen rate. It also contains granular details about rural areas. If you know even the basics of web scraping, this page is a goldmine.
Dataset on individual household electric power consumption. While this isn’t strictly Indian data, it sheds light on the kind of data we do need to collect in the first place. I encourage you to download this dataset, play around with it and come up with solutions as to how we, as a community, can utilize and maximize power consumption to our benefit.
Water
The most critical resource of all, and one of the most misused in India. It seems we see a drought every summer in quite a lot of rural areas, and the situation does not seem to be improving. The water usage is increasing each year and unless we properly assess the usage, it could end up turning into a crisis very soon.
You can predict things like the predicted water level, the usage in certain areas in order to send adequate water supply tanks there in time, etc. You can come up with more ideas as you think about the challenges in this sector.
Resources
Open datasets from the Central Ground Water Board. This contains granular information about water levels in every district in India. The variables it includes are the district name, latitude and longitude, type of site, the year the data was observed, and the water level during, after and before monsoons. It’s a good place for you to understand the kind of data collected by the Government, and even work on it on your own!
Open datasets on water quality in 2014. Plenty of datasets to download and work with here. It is available for different states so pick and choose as per your interest.
Healthcare
Did you know that the Indian constitution guarantees free healthcare for all citizens? And that’s the practice Government hospitals follow, at least for those who are below the poverty line. But the truth is that the private healthcare sector takes care of the majority of the healthcare business in the country. With the amount of people populating government hospital, it is not easy to get proper attention there.
Which is why people who can afford it tend to turn to the private hospitals. They prefer paying from their own pockets than putting themselves through the rigors of a government hospital. According to Wikipedia, 58% of the hospitals in India are private along with a mind-boggling 81% doctors.
The current infrastructure is just not good enough to handle the growing demands and the surging population. This is where data science can step in and ease the burden. Predicting things like how many days will a patient be admitted so as to calculate the proper allotment of beds, child mortality rate, heart issues, diabetes, etc. are some of the points you can work with for starters. The NITI Aayog initiative is already working on quite a lot of these points.
Resources
Dataset on key indicators of annual health survey. These are survey results for nine Indian states from 2012-13. It is a very comprehensive dataset and contains 1,287 columns. If you are serious about analyzing and working with Indian healthcare data, this is as good a place as any to start.
Multiple datasets on the government’s data site. If you wish to analyze the state of healthcare at a more granular level, check out this link. It contains all sorts of information about the various aspects of healthcare, from OPD attendance to the comparison of various health indicators around the country.
Datasets curated by the World health Organization. This is a treasure trove of data on healthcare in India, collected by WHO. It contains datasets on infant mortality rate, life expectancy at birth, hospital beds, etc.
Education
The state of education in India is appalling, to say the least. While more Indians are enrolled in schools than ever before, they are not really being educated. Outside the cream of the crop private schools, there is no proper structure, focus or attention given to the majority of children in rural areas.
Almost 95% children have enrolled in primary school, 69% in secondary and a shockingly meager 25% in post secondary. Where is it all going wrong? Why can’t one of the biggest school systems in the world improve upon this? What is the expected years of schooling education?
Using data from national surveys, you can analyze and try to find answers to these pressing questions. As with any data science project, curiosity will help you a lot. This is a field that’s very close to me so any progress, however minor, has the potential to start a ripple effect.
Resources
Comprehensive district-level dataset. This is a really detailed dataset covering the length and breadth of report card information categorized by district. It contains 439 columns with zero milling values. What a great place to begin!
Open datasets from the government. These are not so neat and tidy. You will require a bit of preprocessing and research to work with these properly, but they highlight the true nature of education here, including data on teaching staff and education loans.
Traffic/Road Accidents
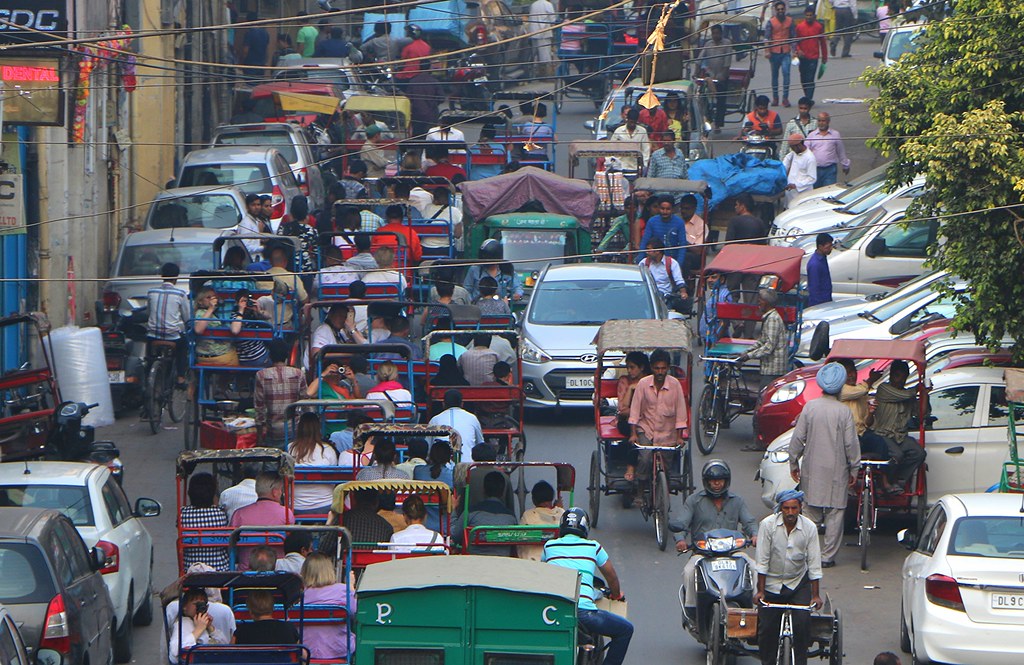
Ah, one of the most frustrating things we encounter on an almost daily basis. As more and more people flock to metro cities, the state of traffic on the roads is getting worse. Long traffic jams are an accepted part of our lives, but should they be? The NITI Aayog team is working on understanding why this happens, and how to deal with them.
Aspects like choke points, narrow or broken roads, lack of traffic personnel, and failure of traffic lights, are just some of the features you can look at when trying to solve this problem. Cities like Kuala Lumpur and Toronto are already being converted into smart cities, with CCTV cameras and sensors everywhere to monitor traffic and imediaetely solve the problem.
India is a fair way off that, though we saw earlier this year how the Kolkata police is trying to use Google Maps with the aim of dealing with long jams.
Another aspect of road transport is the number of accidents on the road. India records some of the world’s largest road fatalities every year. According to an Economic Times article, more than 150,000 people are killed in these accidents every year! This is a terribly distressing number and I hope data science can be used to analyze patterns and take immediate action on this.
Resources
Datasets on road accidents. These are quite a few in number and cover features like accidents due to intake of alcohol/drugs, overspeeding, over crowding, over loading of trucks, etc.
Accidents in India by month (2001-2014) dataset. You will need to carefully import this data but it’s a good starting point for analyzing and extracting any patterns, if you can.
Traffic Data. Unfortunately there’s no single resource that contains the traffic data for India. Thankfully there are simple ways to get it. You can head over to Google Maps and export the data in a jiffy. Check out this article which explains how to do it. Once you download it, you can get to analyzing where the traffic jams regularly occur, at what time that happens, and can come up with ways to mitigate it. The possibilities are vast and making your city a smart one is now in your hands!
Air Pollution Levels
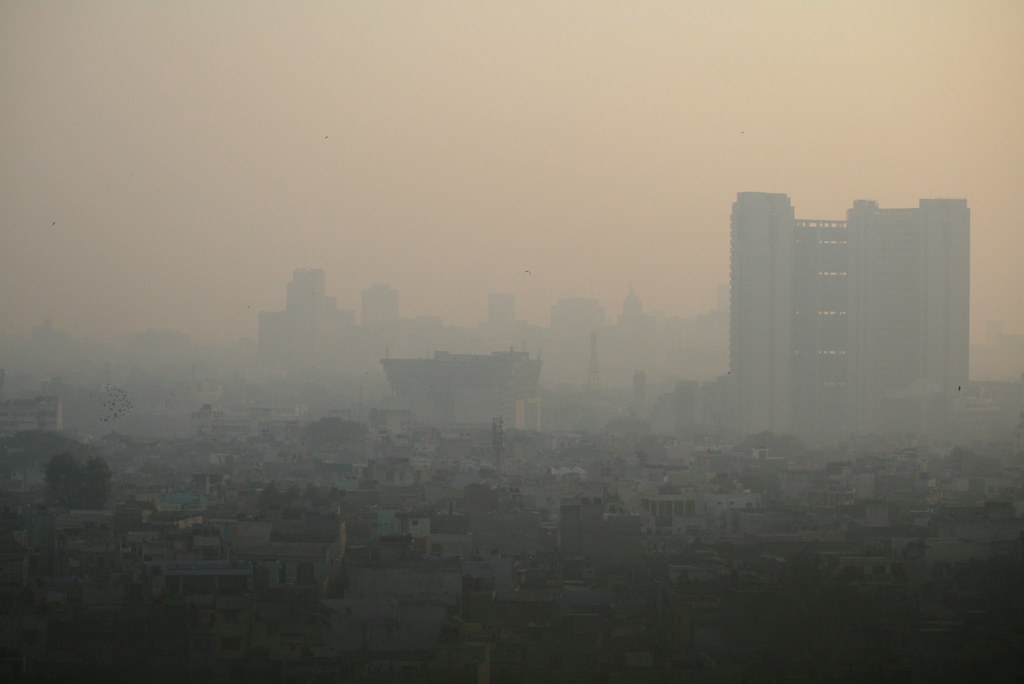
Anyone with access to news will be aware how bad the air pollution levels are in certain parts on India. It is beyond the “out of hand” stage. Despite taking precautions and trying out different measures, the pollution level has not really come down to a manageable state.
According to a WHO report from 2016, 11 of the top 12 most polluted cities come from India (Kanpur leads the way). The Environment Performance Index ranked India 141 out of 180 nations. All this is to say that the problem is grave, and we need a permanent solution to this in double-quick time.
Variables like crop burning, pollution from vehicles, industry fuel and biomass burning, etc. are major contributors to the alarming rise in air pollution. While there have been recent studies done using data science on the topic, none have so far been able to bring down the numbers.
Resources
Air Quality Data for India. This contains historical data on India’s air pollution levels and has spawned many a projects. It’s a brilliant starting point for anyone looking to work with this kind of data.
Daily Ambient Air Quality Data. Coming from the Government itself, this is a location wise dataset measuring the air quality in 2015. You can also check out their entire catalog on air pollution here if you so wish. It’s a little unstructured so patience is key!
Air Quality Info Site. A really cool website displaying the different statistics associated with air quality indices in India. It has forecasts for daily, monthly, and hourly numbers. Bookmark this site!
End Notes
The resources I have mentioned here are enough to get you started in each sector. There are other datasets and resources out there which you can get your hands on to practice more. There are government sites where you can request more data, if required.
There is so much scope for improving each of these sectors with the help of data science. I’m looking forward to our community making a huge impact (in a positive way of course!) soon! If there are any other datasets you are aware of and want to share with the community, please feel free to do so in the comments section below.


