Computer networks are composed of or contain many pieces of hardware and software. To simplify network design, various networks are organized and arranged as a stack of layers of hardware and software, one on top of another. The main purpose of each layer is just to offer and provide services to higher layers that are present. This is the Protocol Hierarchy.
While working with large captures, the visual interpretation and the knowledge of the protocol stack helps us to determine the goal of the communication. There are many tools available that make it easy to identify the protocols present in the capture file. Wireshark’s “Protocol Hierarchy Statistics” is extensively used for this purpose.
Wireshark’s Protocol Hierarchy Statistics :
- Start the Wireshark by selecting the network we want to analyze.
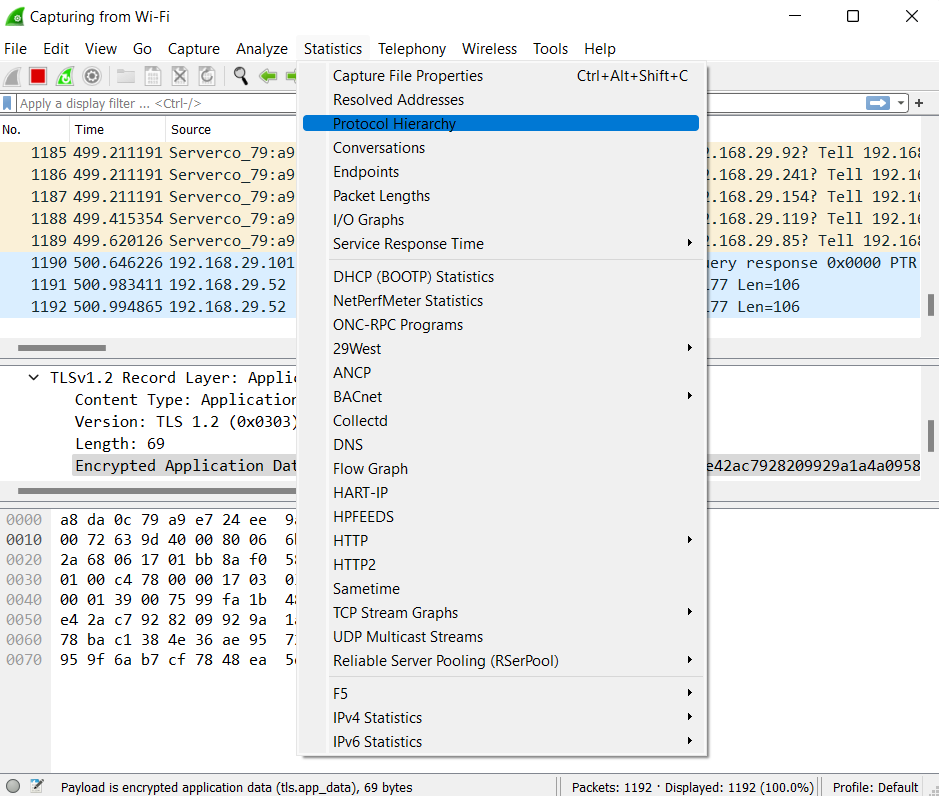
- Now go into the Wireshark and click on Statistics→ Protocol Hierarchy menu or toolbar item.

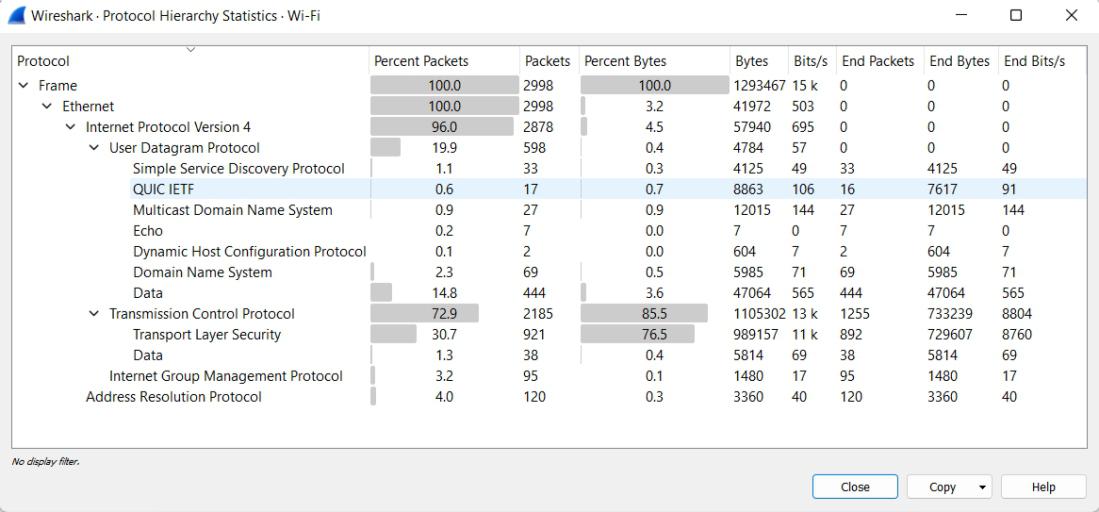
This will then bring up the “Protocol Hierarchy Statistics” window.

The above screenshot displays the list of protocol stacks present in the capture. The data is organized based on the layers of communication since packets include some encapsulated protocols. For example, the HTTP packet is underneath the TCP packet and both are underneath the IP packets.
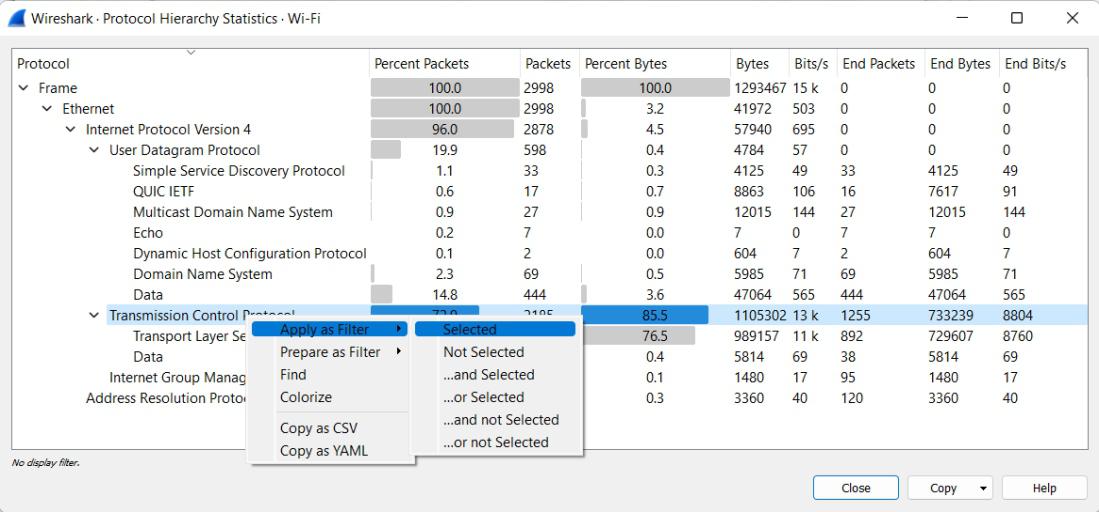
The window displays the stack of all the protocols in the capture. Each row listed in the tree structure has the statistical values of the protocol. If a display filter is set already in the main window it will be shown at the bottom. Otherwise, we can apply the filter directly from this window.
To apply the filter directly from the Protocol Hierarchy Statistics window click on any of the protocols listed in the tree structure and then select “Apply as Filter” >> “Selected”.

The Protocol Hierarchy Statistics window displays the following information:
- Protocol: This column displays the protocol name.
- Percent Packets: This column displays the percentage of protocol packets relative to all packets present in the capture.
- Packets: This column displays the total number of packets that have this protocol.
- Percent Bytes: This column displays the percentage of protocol bytes relative to the total bytes present in the capture.
- Bytes: This column displays the total number of bytes of this protocol.
- Bits/s: This column displays the bandwidth of this protocol relative to the capture time.
- End Packets: When this protocol is at the top of the stack then the value of the absolute number of packets of this protocol is listed in this column.
- End Bytes: When this protocol is at the top of the stack then the value of the absolute number of bytes of this protocol is listed in this column.
- End Bits/s: When this protocol is at the top of the stack then the bandwidth of this protocol relative to the capture time is listed in this column.
Most of the packets usually contain several protocols due to which more than one protocol will be counted for each packet. The same protocol will be present in a single packet more than once.


