Given two quaternions x and y, the product xy might equal the product yx, but in general the two results are different.
How different are xy and yx on average? That is, if you selected quaternions x and y at random, how big would you expect the difference xy – yx to be? Since this difference would increase proportionately if you increased the length of x or y, we can just consider quaternions of norm 1. In other words, we’re looking at the size of xy – yxrelative to the size of xy.
Here’s simulation code to explore our question.
    import numpy as np

    def random_unit_quaternion():
        x = np.random.normal(size=4)
        return x / np.linalg.norm(x)

    def mult(x, y):
        return np.array([
            x[0]*y[0] - x[1]*y[1] - x[2]*y[2] - x[3]*y[3],
            x[0]*y[1] + x[1]*y[0] + x[2]*y[3] - x[3]*y[2],
            x[0]*y[2] - x[1]*y[3] + x[2]*y[0] + x[3]*y[1],
            x[0]*y[3] + x[1]*y[2] - x[2]*y[1] + x[3]*y[0]
        ])


    N = 10000
    s = 0
    for _ in range(N):
        x = random_unit_quaternion()
        y = random_unit_quaternion()
        s += np.linalg.norm(mult(x, y) - mult(y, x))

    print(s/N)
In this code x and y have unit length, and so xy and yx also have unit length. Geometrically, x, y, xy, and yx are points on the unit sphere in four dimensions.
When I ran the simulation above, I got a result of 1.13, meaning that on average xy and yx are further from each other than they are from the origin.
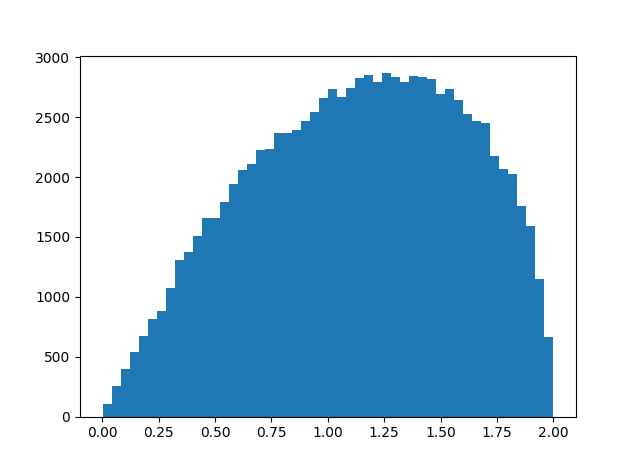
To see more than the average, here’s a histogram of ||xy – yx|| with N above increased to 100,000.
I imagine you could work out the distribution exactly, though it was quicker and easier to write a simulation. We know the distribution lives on the interval [0, 2] because xyand yx are points on the unit sphere. Looks like the distribution is skewed toward its maximum value, and so xy and yz are more likely to be nearly antipodal than nearly equal.
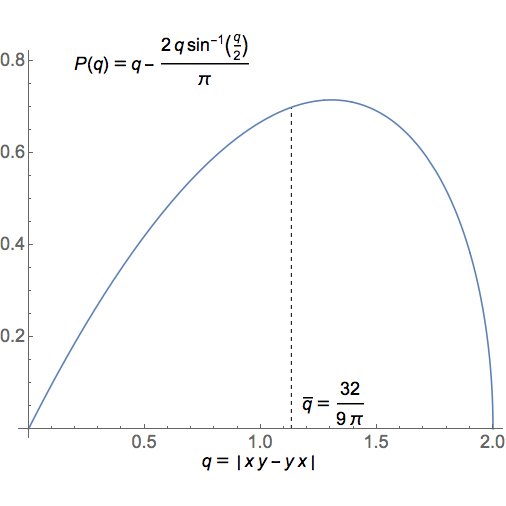
Update: Greg Egan worked out the exact mean and distribution.
Original Source


