In this article, we show you how it was possible to read nutritional tables with Optical Character Recognition(OCR), Tesseract, and a lot of computer vision!
Some time ago I was immersed in a project that worked with the formation of a data lake of food data, collecting from products in general to the nutritional information of a mass of food, however at a certain point it was realized that most of the nutritional information was inserted in images and not in the text, making it difficult to web scrapping with the Scrapy framework and Python.
This problem opened the opportunity to learn something that has been present in technology for a long time and gained percussion with David H. Shepard. This technology is well known as Optical Character Recognition (OCR). In fact, the following video is very cool to get a sense of the early days of OCR:
So the challenge was that from an image, it would be possible to get the data from nutritional tables in the text.
Table of contents:
- Tesseract e PyTesseract;
- Theory of Tables;
- EAST;
- Symspell;
- Flowchart and Implementation.
Tesseract e PyTesseract
Searching about Optical Character Recognition, I came across a tool that is currently leading in use, as well as being known for its great efficiency. This tool is Tesseract.
Tesseract is an open-source engine under the Apache 2.0 license that is currently owned by Google and aims to apply optical character recognition. Its initial implementation happened with the C language, being developed by HP. For more details, feel free to look at the repository on GitHub or refer to the following article, which is also quite complete on the subject: Optical Character Recognition (OCR) for Low Resource languages with Tesseract version.
However, with the growing use of the Python language, the community took up this cause and developed a wrapper that was named Pytesseract, covering all the features that belong to the original project. Pytesseract is also an open-source project that is available on GitHub or ready for use on the Python Package Index (PyPI).
This engine and package were essential for the development of the project, to the point that they became a requirement (which is covered in the project repository).
Theory of Tables
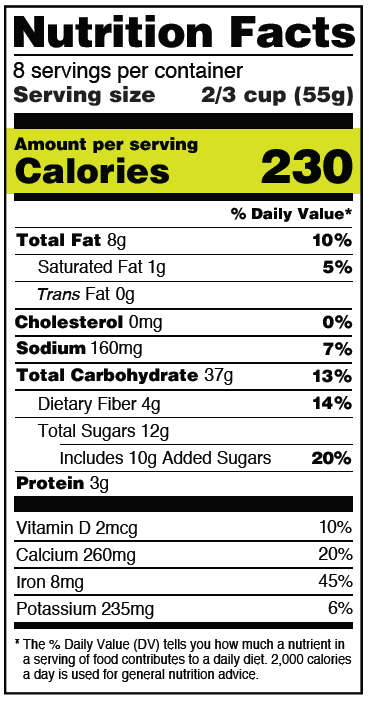
As mentioned at the beginning of the project the challenge was focused on reading nutritional tables, and unlike a controlled environment, when it comes to nutritional tables, we have many words that are sometimes disconnected, besides horizontal lines and vertical lines that separate the words from the values, so the question is: how to make it easier for the machine to read them? That is, the mission was to remove these lines and columns and leave only the words and values so that we would not “divert” the machine’s attention to what it did not need to know.
To solve this problem two things were done.
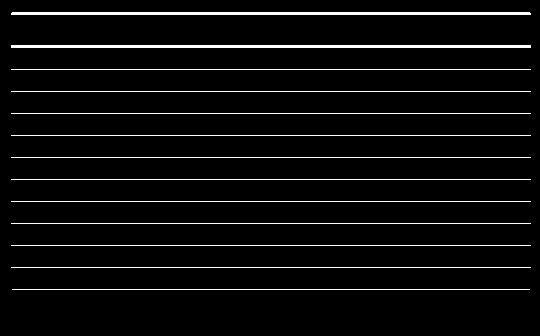
The first was to use horizontal and vertical kernels to identify where these lines were, generating a binarized image. To do this we used OpenCV, a complete and very popular Python imaging library. Below is the result of the lines found.
But once you have these lines identified, how do you delete them from the image?
K-means
The answer was no less than K-means, an unsupervised machine learning algorithm that is commonly used for clustering, which needs no external inputs for its operation, needing only to determine the number of K-means, i.e. the number of clusters required for your problem.
But what’s with the K-means after all? What does it have to do with the problem of lines?
As described in its brief introduction, k-means is used for grouping, so instead of deleting the rows we performed a color clustering on the image and overwrote (instead of deleting) the rows by the predominant color of the image, and usually, when it comes to a nutrition table, the predominant colors are for the background, rows, letters and sometimes details, respectively.
For this reason, also, the infamous elbow method was not used to define the amount of Ks, because we have a situation with the known number of clusters needed.
The result of this process is shown in the image below, as are the functions used to overwrite the lines detected a priori. The code for using k-means can be found in detail in the sklearn library or in the project repository.
def remove_lines(image, colors):
    gray_image = cv2.cvtColor(image, cv2.COLOR_BGR2GRAY)
    bin_image = cv2.threshold(
        gray_image, 0, 255, cv2.THRESH_BINARY_INV + cv2.THRESH_OTSU)[1]

    h_contours = get_contours(bin_image, (25, 1))
    v_contours = get_contours(bin_image, (1, 25))

    for contour in h_contours:
        cv2.drawContours(image, [contour], -1, colors[0][0], 2)

    for contour in v_contours:
        cv2.drawContours(image, [contour], -1, colors[0][0], 2)

    return image


def get_contours(bin_image, initial_kernel):
    kernel = cv2.getStructuringElement(cv2.MORPH_RECT, initial_kernel)

    detected_lines = cv2.morphologyEx(
        bin_image, cv2.MORPH_OPEN, kernel, iterations=2)

    contours = cv2.findContours(
        detected_lines, cv2.RETR_EXTERNAL, cv2.CHAIN_APPROX_SIMPLE)
    contours = contours[0] if len(contours) == 2 else contours[1]

    return contours
Functions used to remove lines of an image. Font: Author.
EAST — Efficient and Accurate Scene Text Detector
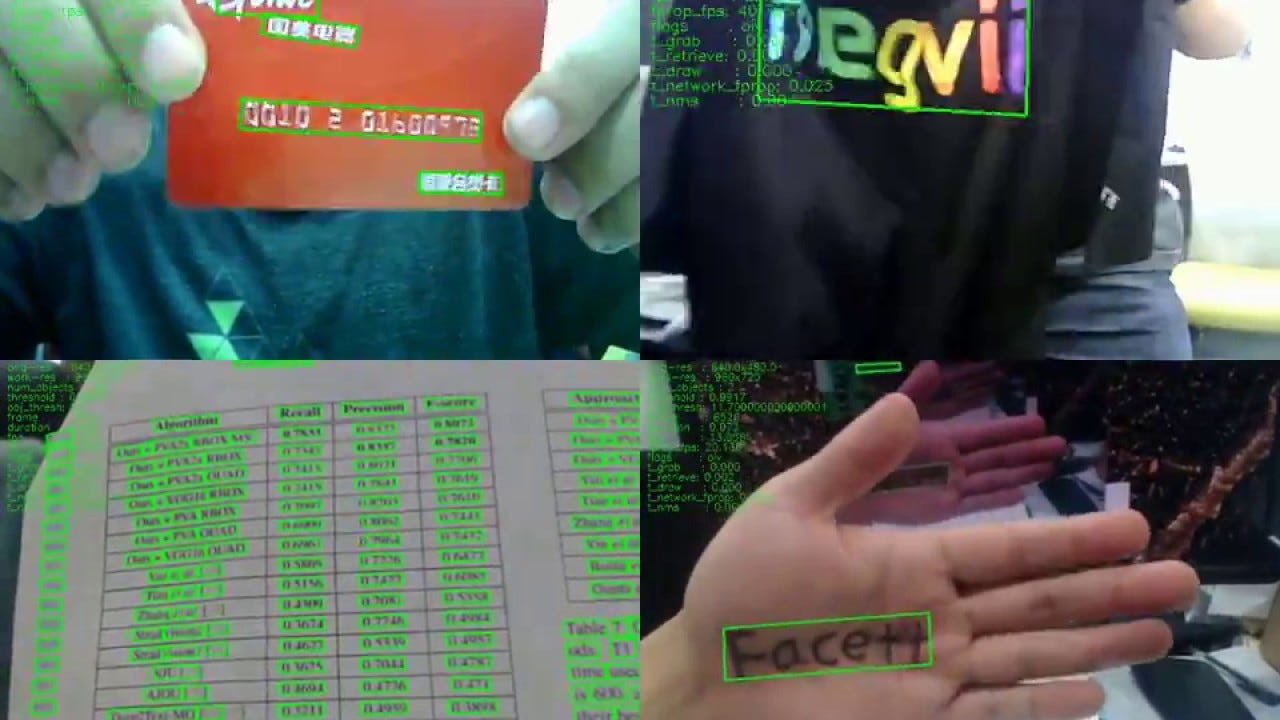
At this stage, we still don’t have a machine reading, but we use EAST, a scene text detector that is also open source with the code available on GitHub and, in this project, was used with the goal of making the machine work even easier, taking away distractions and focusing on the image text.
As I said, EAST alone only locates where there is text, but does not read it, a process which we can assimilate to an illiterate, who knows that there is text there, but has no idea what is written. Its result can be seen in the image below:
There are excellent tutorials and publications on the Internet that teach how to use this kind of technology, of which I can mention: Optical Character Recognition (OCR) for Low Resource languages with Tesseract version
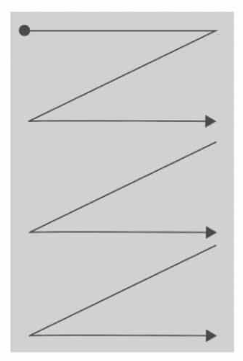
After applying EAST with a series of morphological filters, we then read the words in the Western style, i.e., from top to bottom and from left to right, making it closer to what is done in human reading, as is demonstrated in the following image.
At this stage, we can assimilate no longer an illiterate, but a child who is learning to read and understands a few things. But how can “this child’s” reading be corrected or improved?
SymSpell
SymSpell is an alternative algorithm to the Symmetric Delete spelling correction algorithm, and SymSpell has been found to be 1000x faster at performing this task, working with a dictionary that is loaded into memory and supports a number of languages. Its repository is on GitHub and can be accessed from the following link- Optical Character Recognition (OCR) for Low Resource languages with Tesseract version
Continuing with our assimilation, in this case, we can say that SymSpell is like a teacher for our reading, which applies corrections by working with a similar distance between words.
FlowChart Implementation
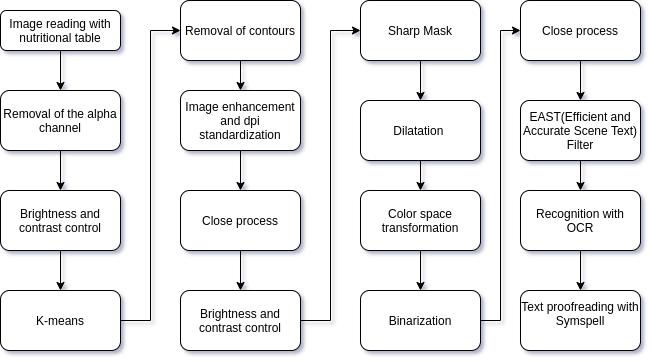
The whole process of reading the image with the nutrition table until you have the text corrected and ready for use is summarized in the following image.
Furthermore, the entire implementation of this project is available in both the Python Package Index (PyPI) and can be used in just 3 lines, as in the following example.
from nkocr import OcrTable

text = OcrTable("paste_image_url_here")
print(text) # or print(text.text)
It is worth saying that this project is part of the open-source community and has new implementation participation, including yours! Feel free to contribute pull requests and issues.
Thank you very much for reading, I hope it has added something to your life. Feel free to contact me for more information!
References
5 . A quick overview of the implementation of a fast spelling correction algorithm
The media shown in this article are not owned by Analytics Vidhya and is used at the Author’s discretion.


… [Trackback]
[…] Information on that Topic: geeksforgeeks.org/how-did-the-machine-read-nutritional-facts-using-optical-character-recognition/ […]