Introduction
Exploratory Data Analysis (EDA) helps us to uncover the underlying structure of data and its dynamics through which we can maximize the insights. EDA is also critical to extract important variables and detect outliers and anomalies. Even though there are many algorithms in Machine Learning, EDA is considered to be one of the most critical part to understand and drive the business.
There are several ways to perform EDA on various platforms like Python (matplotlib, seaborn), R (ggplot2) and there are a lot of good resources on the web such as “Exploratory Data Analysis” by John W. Tukey, “Exploratory Data Analysis with R” by Roger D. Peng and so on..
In this article, I am going to talk about performing EDA using Kibana and Elastic Search.
Table of Contents
- Elastic Search
- Kibana
- Creating dashboards
- Indexing data
- Linking Kibana
- Making visualizations
- Search bar
1. Elastic Search (ES)
Elastic Search is an open source, RESTful distributed and scalable search engine. Elastic search is extremely fast in fetching results for simple or complex queries on large amounts of data (Petabytes) because of it’s simple design and distributed nature. It is also much easier to work with than a conventional database constrained by schemas, tables.
Elastic Search provides a distributed, multitenant-capable full-text search engine with an HTTP web interface and schema-free JSON documents.
Installation of Elastic Search
Installation and initialization is quite simple and it is as follows:
- Download and unzip Elasticsearch
- Change the directory to Elasticsearch folder
- Run bin/elasticsearch (or bin\elasticsearch.bat on Windows)
Elasticsearch instance should be running at http://localhost:9200 in your browser if you run with default configuration.
Keep the terminal open where elastic search is running to be able to keep the instance running. you could also use nohup mode to run the instance in the background.
2. Kibana
Kibana is an open source data exploration and visualization tool built on Elastic Search to help you understand data better. It provides visualization capabilities on top of the content indexed on an Elasticsearch cluster. Users can create bar, line and scatter plots, or pie charts and maps on top of large volumes of data.
Installation
Installation and initialization is similar to that of Elasticsearch:
- Download and unzip Kibana
- Open config / Kibana.yml in an editor and Set elasticsearch.url to point at your Elasticsearch instance
- Change the directory to Kibana folder
- Run bin/Kibana (or bin\Kibana.bat on Windows)
Kibana instance should be running at http://localhost:5601 in your browser if you run with default configuration.
Keep the terminal open where Kibana was run to be able to keep the instance running. you could also use nohup mode to run the instance in the background.
3. Creating Dashboards
There are mainly three steps to create dashboards using ES and Kibana. I will be using Loan prediction practice problem data to create a dashboard. Please register for the problem to be able to download the data. Please check the data dictionary for more information.
Note: In this article I will be using python to read data and insert data into Elasticsearch for creating visualizations through Kibana.
Reading data
import pandas as pd
train_data_path = '../loan_prediction_data/train_u6lujuX_CVtuZ9i.csv'
test_data_path = '../loan_prediction_data/test_Y3wMUE5_7gLdaTN.csv'
train = pd.read_csv(train_data_path); print(train.shape)
test = pd.read_csv(test_data_path); print(test.shape)
(614, 13)
(367, 12)
Python Code:

3.1 Indexing data
Elastic Search indexes data into its internal data format and stores them in a basic data structure similar to a JSON object. Please find the below python code to insert data into ES. Please install pyelasticsearch library as shown below for indexing through python.
Note: Please note that the code assumes that the elastic search is run with default configuration.
pip install pyelasticsearchfrom time import time from pyelasticsearch import ElasticSearch CHUNKSIZE=100 index_name_train = "loan_prediction_train" doc_type_train = "av-lp_train" index_name_test = "loan_prediction_test" doc_type_test = "av-lp_test"
def index_data(data_path, chunksize, index_name, doc_type):
    f = open(data_path)
    csvfile = pd.read_csv(f, iterator=True, chunksize=chunksize)
    es = ElasticSearch('http://localhost:9200/')
    try :
        es.delete_index(index_name)
    except :
        pass
    es.create_index(index_name)
    for i,df in enumerate(csvfile):
        records=df.where(pd.notnull(df), None).T.to_dict()
        list_records=[records[it] for it in records]
        try :
            es.bulk_index(index_name, doc_type, list_records)
        except :
            print("error!, skiping chunk!")
            pass
index_data(train_data_path, CHUNKSIZE, index_name_train, doc_type_train) # Indexing train data
index_data(test_data_path, CHUNKSIZE, index_name_test, doc_type_test) # Indexing test data
DELETE /loan_prediction_train [status:404 request:0.010s]
DELETE /loan_prediction_test [status:404 request:0.009s]
3.2 Linking Kibana
- Now point your browser to http://localhost:5601
- Go to Management. Click on Index Patterns. Click on Add new.
- Check box if your data indexed contains timestamp. Here, uncheck the box.
- Enter the same index we used to index the data into ElasticSearch. (Example: loan_prediction_train).
- Click on create.
Repeat the above 4 steps for loan_prediction_test. Now kibana is linked with train and test data present in elastic search
3.3 Create Visualizations
- Click on Visualize > Create a Visualization > Select the Visualization type > Select the index (train or test) > Build
Example 1
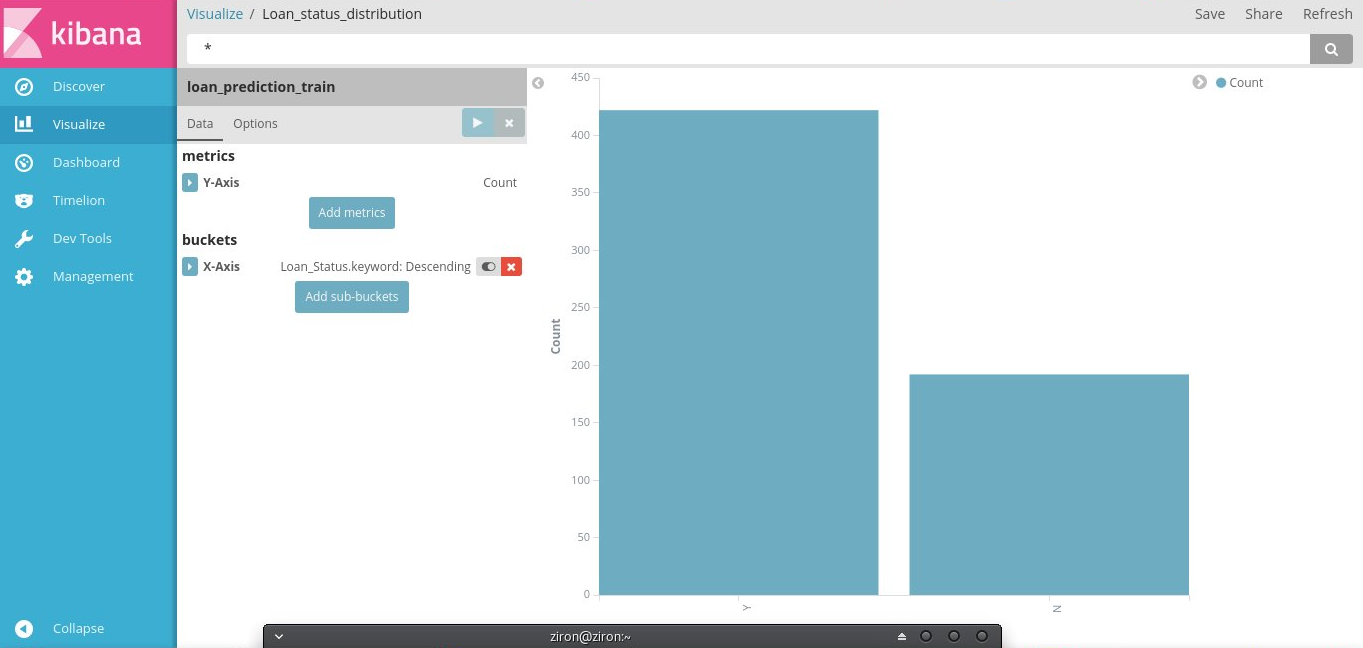
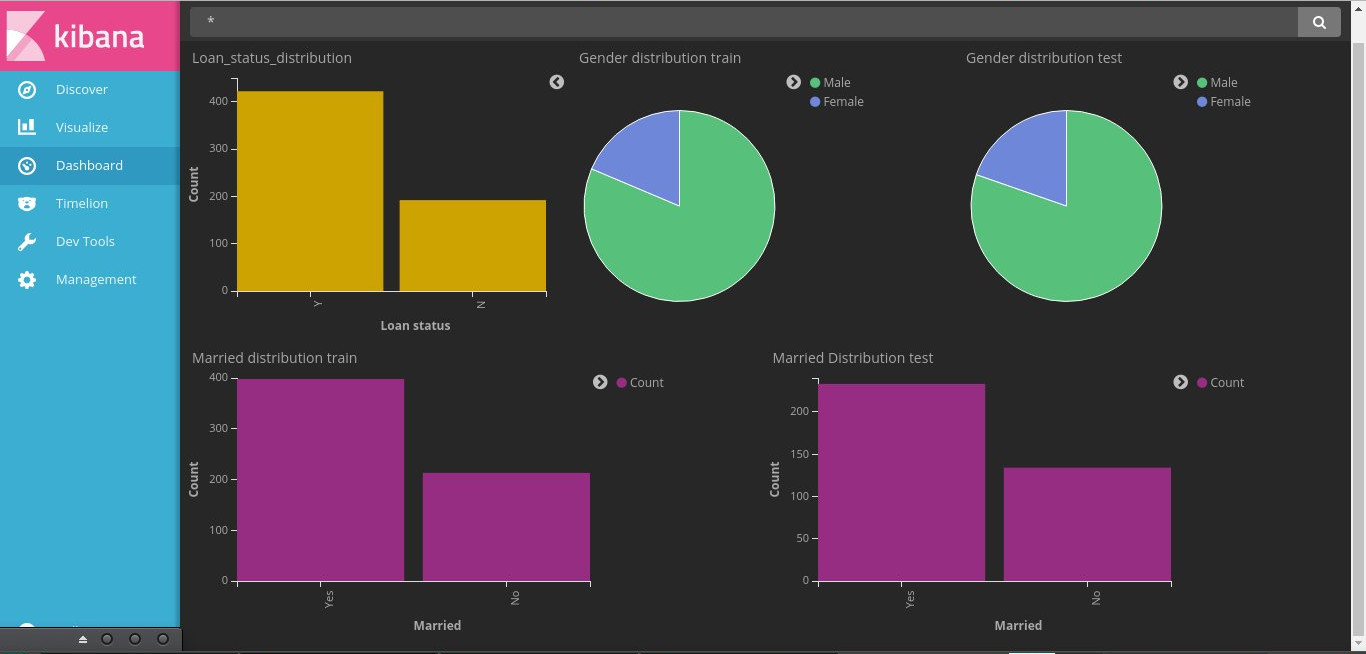
- Select Vertical bar chart and select train index for plotting the Loan_status distribution.
- Select the y-axis as count and x-axis as Loan status
- Save the visualization.
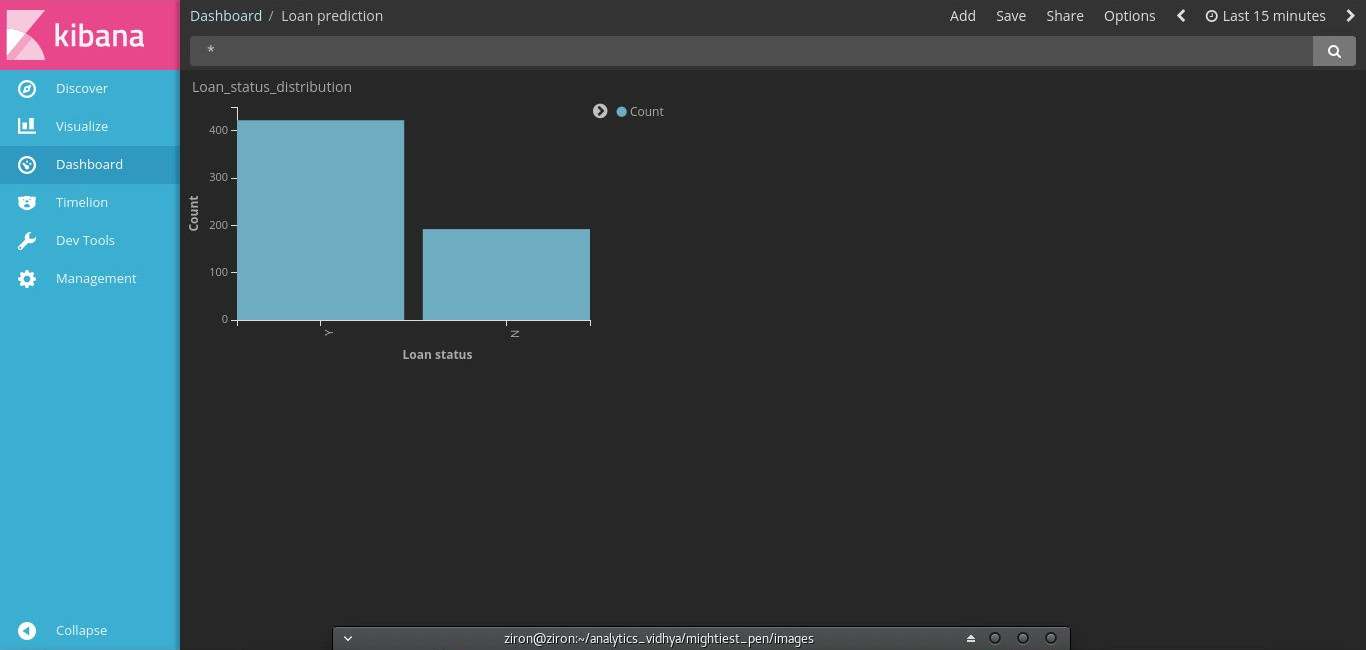
- Add a dashboard > Select the index > Add the visualization just saved.
Voila!! Dashboard created.
Example 2
- Click on visualize > Create a visualization > Select the visualization type > Select the index (train or test) > Build
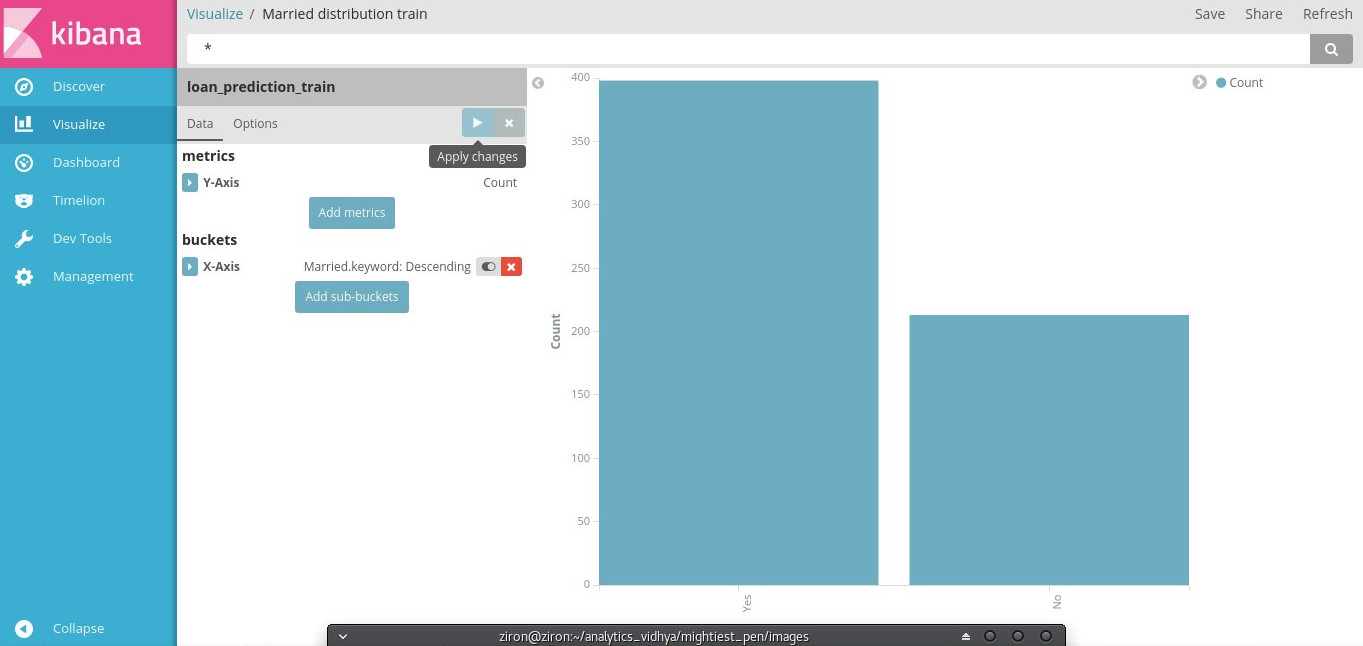
- Select Vertical bar chart and select train index for plotting the Married distribution.
- Select the y-axis as count and x-axis as Married
- Save the visualization.
- Repeat the above steps for test index.
- Open the dashboard already created. Add these visualizations
Example 3
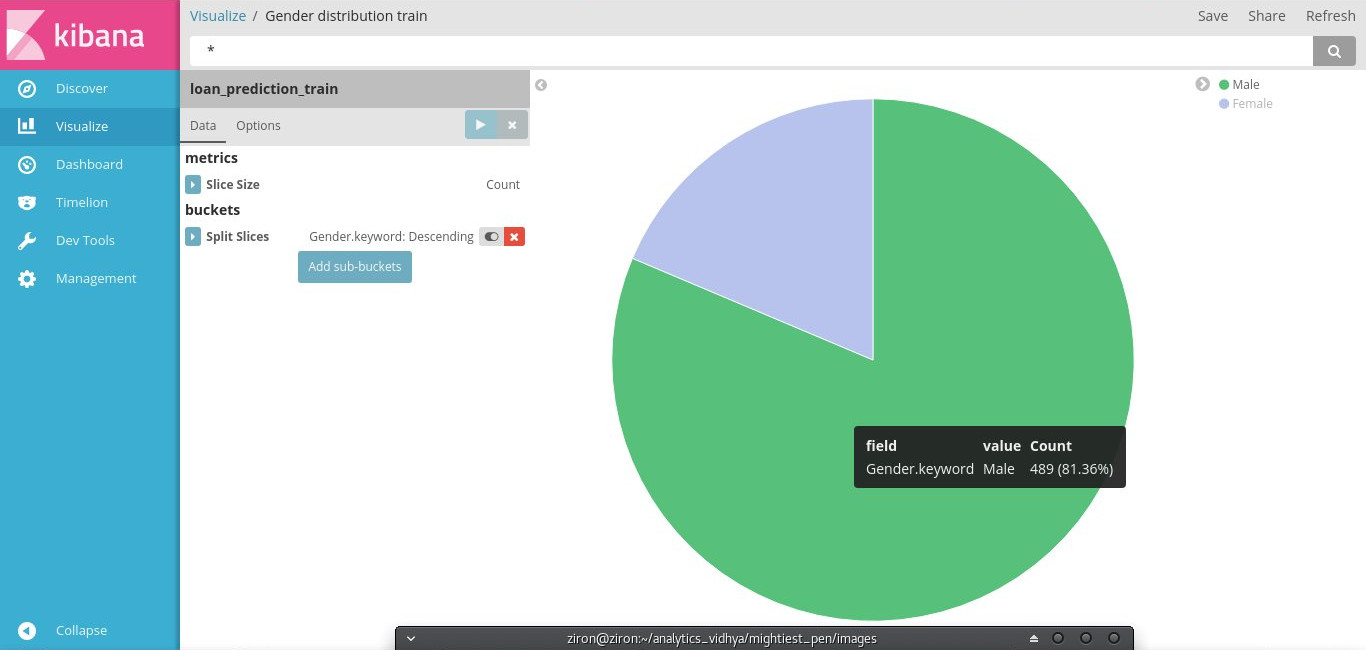
Similarly for Gender distribution. This time we will use pie chart.
- Click on visualize > Create a visualization > Select the visualization type > Select the index (train or test) > Build
- Select Pie chart chart and select train index for plotting the Married distribution.
- Select the slice-size as count and split-slices by Married column
- Save the visualization.
- Repeat the above steps for test index.
- Open the dashboard already created. Add these visualizations
Finally the dashboard with all the visualizations created would look like this!
Beautiful! isn’t it?
Now I leave you here to explore more of elastic search and kibana and create various kind of visualizations
4. Search bar
Search bar allows you to explore data by string search, which helps us in understanding the changes in data with changes in one particular attribute which is not easy to do with visualizations.
Example
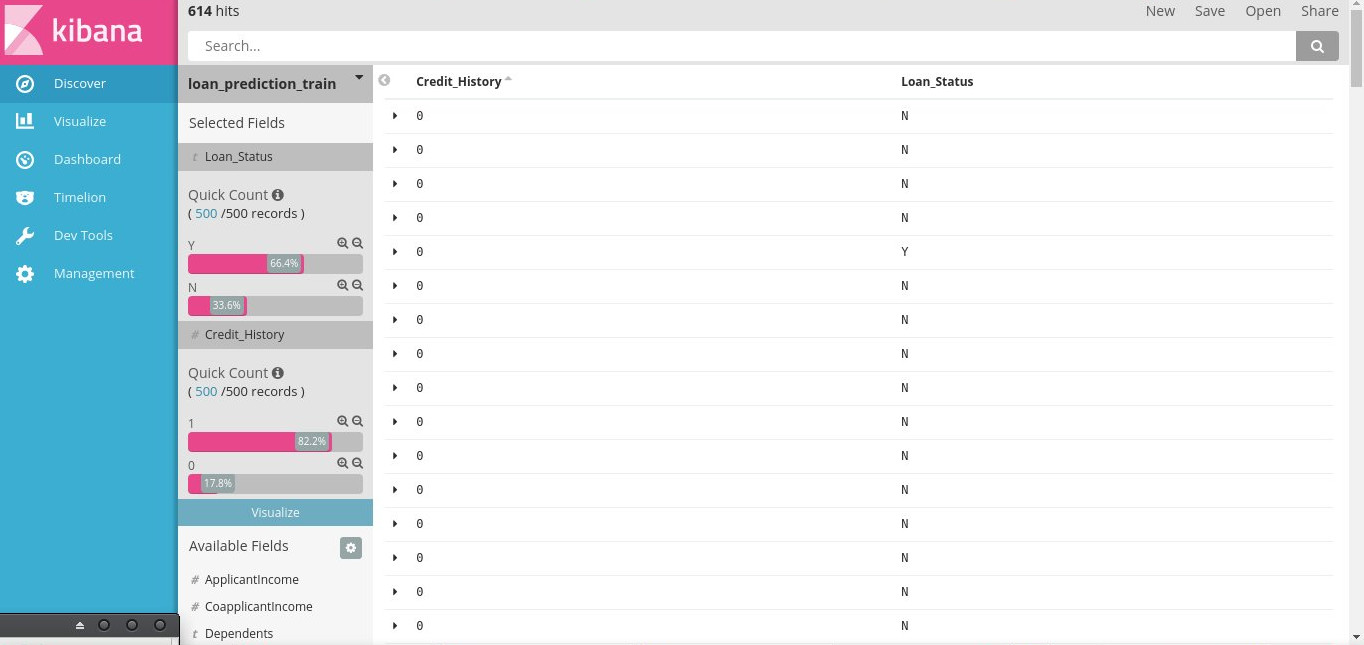
- Go to Discover> Add Loan_Status and Credit_History
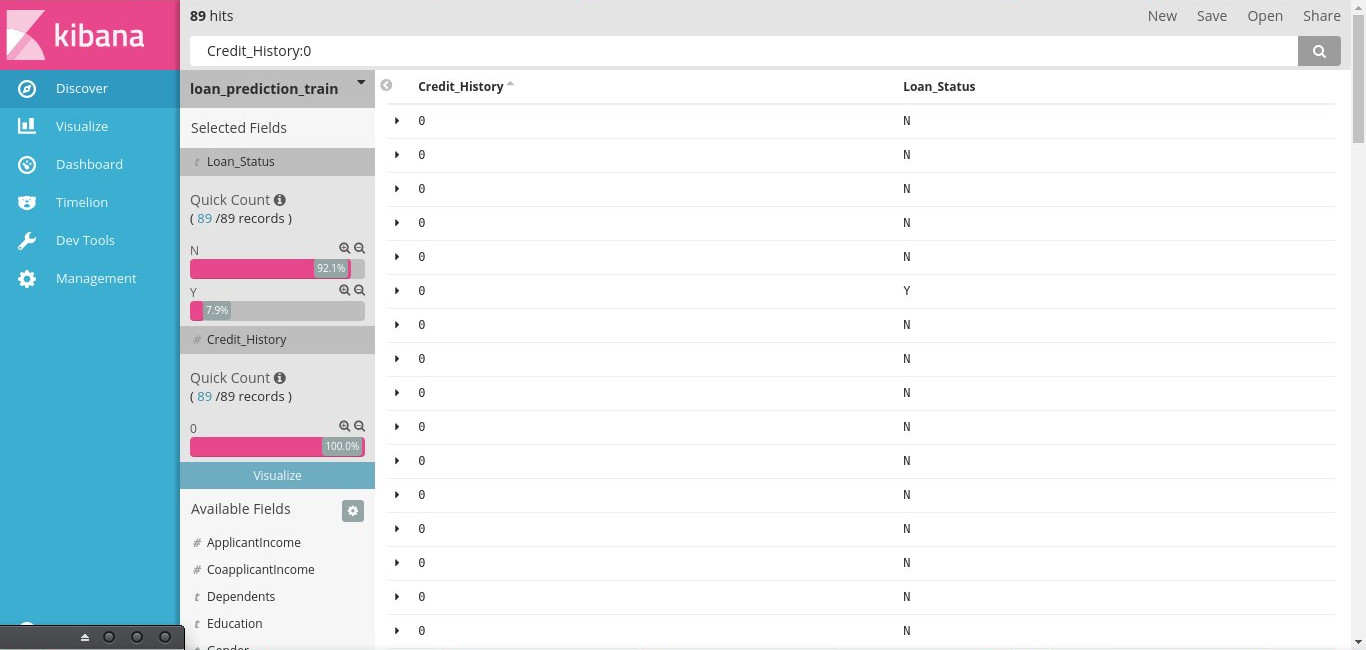
- Using the search bar select only where Credit_History is 0. (Credit_History:0)
- Now you can observe the changes in Loan_Status column.
Before
After
Insight: Most of the clients that had credit history 0 did not receive Loan (Loan status is N = 92.1%)
That’s all!!
This article was contributed by Supreeth Manyam (@ziron) as part of The Mightiest Pen, DataFest 2017. Supreeth won the competition and also finished second in overall leaderboard of DataFest 2017. Supreeth is a passionate Data Scientist who is keen on bringing insights to business and help it get better by analyzing relevant data using Machine Learning and Artificial Intelligence.


