


This article was published as a part of the Data Science Blogathon
Hey Folks, in this article, we will be understanding, how to analyze and predict, whether a person, who had boarded the RMS Titanic has a chance of survival or not, using Machine Learning’s Logistic Regression model.
Brief description about Logistic Regression:
A simple yet crisp description of Logistic Description would be, “it is a supervised learning classification algorithm used to predict the probability of a target variable. The nature of target or dependent variable is dichotomous, which means there would be only two possible classes.” as stated in the tutorial points article.
The graph of logistic regression is as shown below:
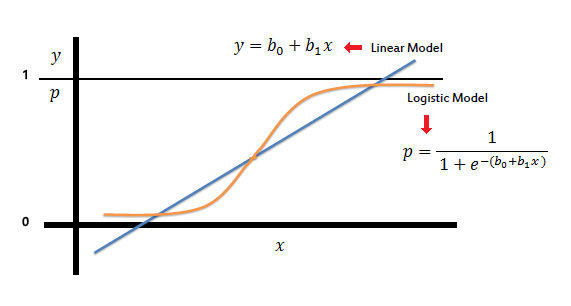
image source: link
Let’s Dive into the process..!! :
Now let us begin the main part of this article.
If you prefer an audio-visual understanding of this process, you can refer to this video below. It goes through everything in this article with a little more detail and will help make it easy for you to start programming your own machine-learning model, even if you don’t have python installed on your computer.
Or you can use both as supplementary materials for learning about machine learning!
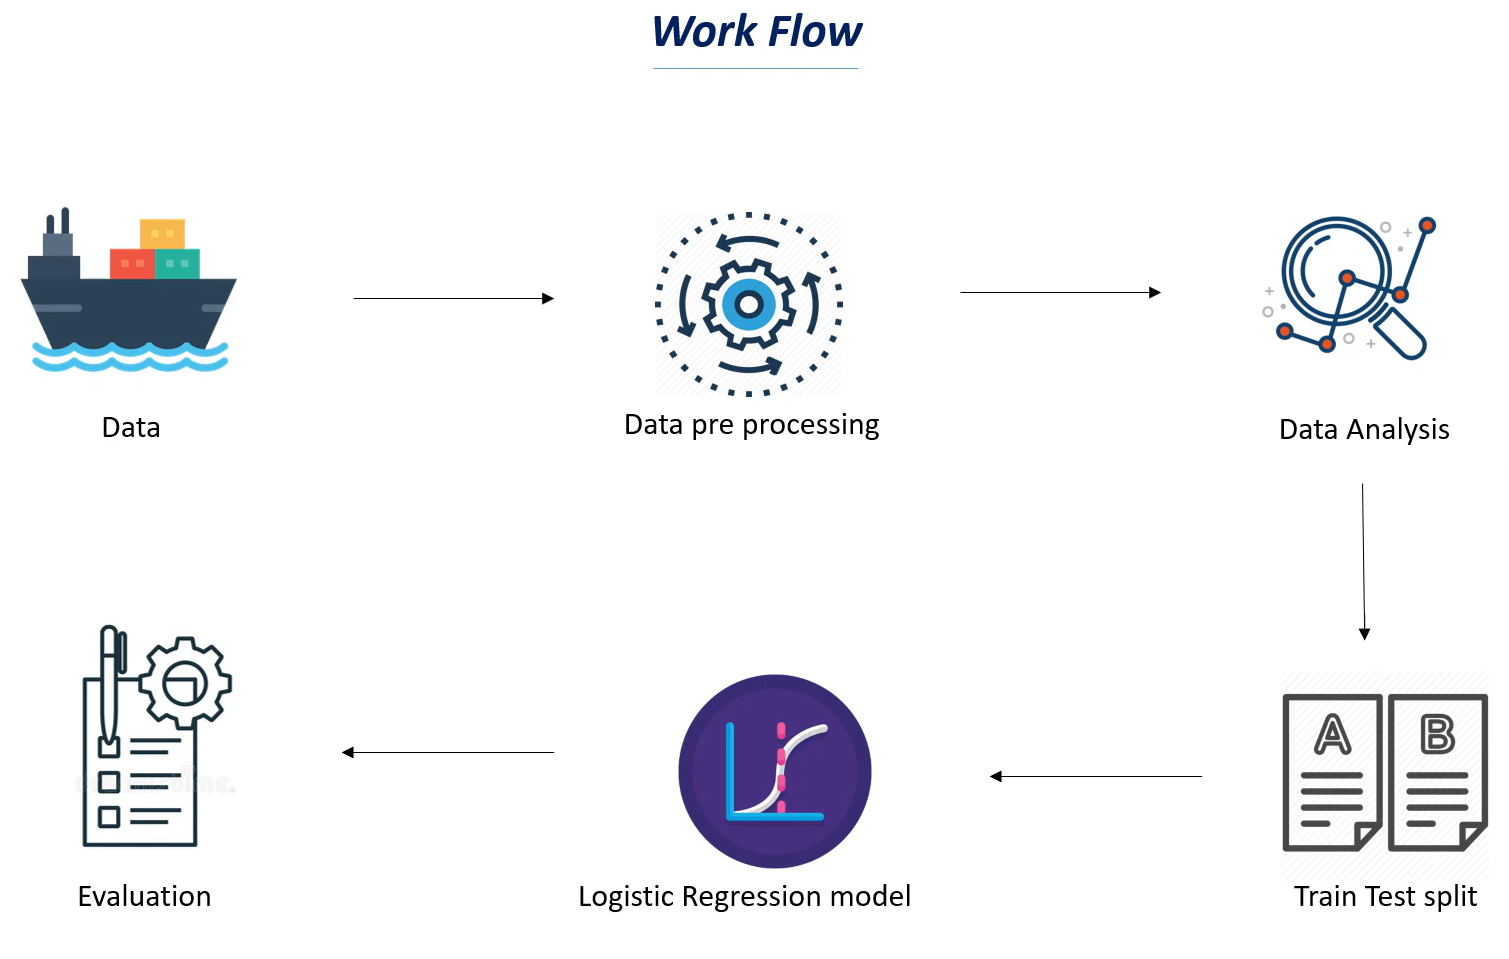
For better understanding, let’s split the task into smaller parts and depict them in a workflow as shown below :
(image source is the video linked above: image_link )
As we now know what we have to do, to accomplish this task, we shall begin with the very first and the most important thing needed in machine learning, a Dataset.
What is a dataset:
A data set, as the name suggests, is a collection of data. In Machine Learning projects, we need a training data set. It is the actual data set used to train the model for performing various actions.
Here, in this case, we will be using a dataset available on the internet. One can find various such datasets over the internet.
The dataset that I’ve used in my code was the data available on Kaggle. You can also download it from here.
One thing must be kept in mind, the larger the data, the more we can train our model, and the more accurate our results come out to be. Don’t worry if all of this sounds weird to you, it will all make sense in a few minutes. 🙂
Let’s Begin with our Coding:
To code, as we know we need a suitable environment, here in my case I’ve used Google Colab, as it reduces the hectic task of compiling and running the program on your PC. You may use any editor as you like.
The foremost that we need to do is import the dependencies that we will be using in our code.
Importing dependencies :
We will be using: NumPy, pandas,matplotlib, seaborn,sklearn.
As we move ahead, you will get to know the use of each of these modules.
Now, we need to upload the downloaded dataset, into this program, so that our code can read the data and perform the necessary actions using it.
As we have downloaded a CSV file, we shall be using Pandas to store that data in a variable.
Our dataset is now stored in the variable named titanic_data.
To get a brief idea about how the data is loaded, we use the command “variable_name.head()” to get a glimpse of the dataset in the form of a table.
The output came out to be as follows:
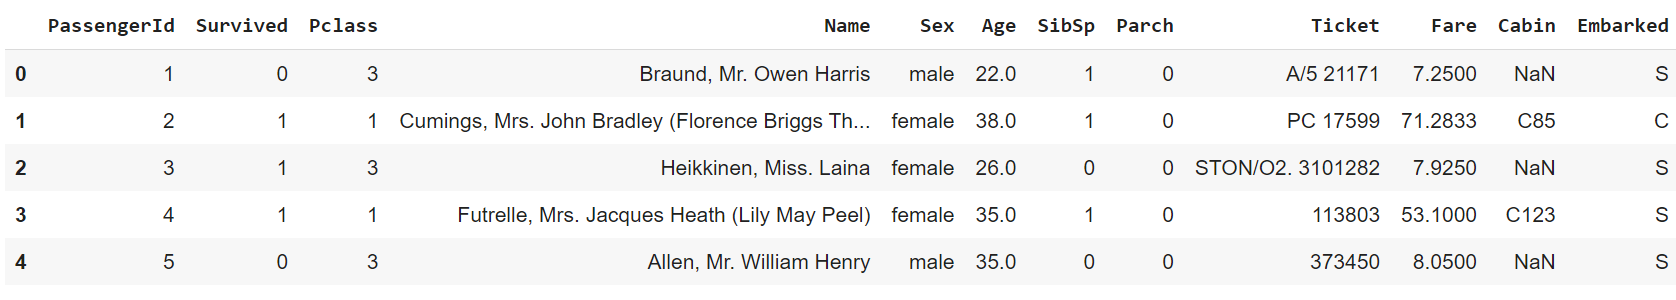
The meaning of the values (SibSp, Parch) can be found on the website from which we have downloaded the dataset.
We have learned from Kaggle while downloading the data set, that the data has 891 rows and 12 columns.
Now, let’s check how many cells are left empty in the table.
titanic_data.isnull().sum()