


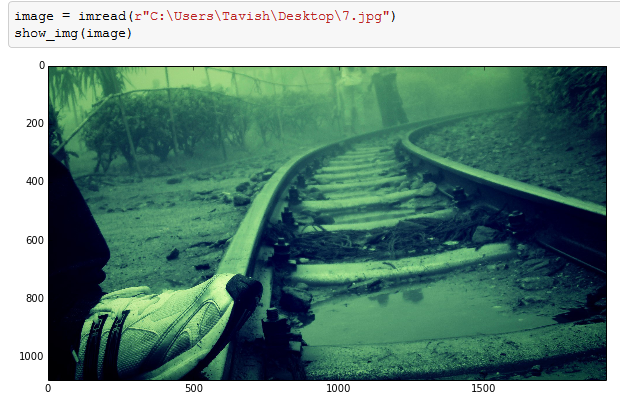
No doubt, the above picture looks like one of the in-built desktop backgrounds. All credits to my sister, who clicks weird things which somehow become really tempting to eyes. However, we have been born in an era of digital photography, we rarely wonder how are these pictures stored in memory or how are the various transformations made in a photograph.
In this article, I will take you through some of the basic features of image processing. The ultimate goal of this data massaging remains the same : feature extraction. But here we need more intensive data cleaning. But data cleaning is done on datasets , tables , text etc. How is this done on an image? We will look at how an image is stored on a disc and how we can manipulate an image using this underlying data?
Importing an Image
Importing an image in python is easy. Following code will help you import an image on Python :
Understanding the underlying data
This image has several colors and many pixels. To visualize how this image is stored, think of every pixel as a cell in matrix. Now this cell contains three different intensity information, catering to the color Red, Green and Blue. So a RGB image becomes a 3-D matrix. Each number is the intensity of Red, Blue and Green colors.
Let’s look at a few transformations:
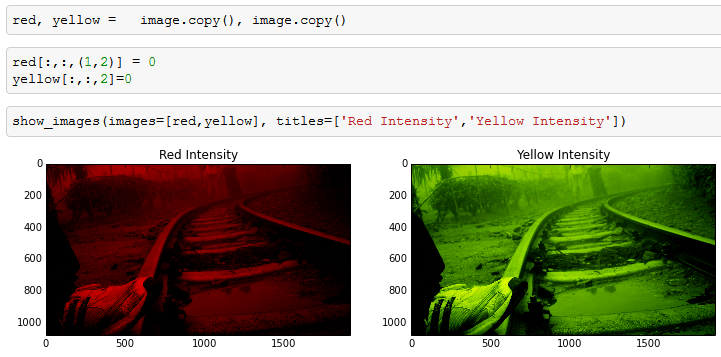
As you can see in the above image, we manipulated the third dimension and got the transformation done. Yellow is not a direct color available in our dictionary but comes out as combination of red and green. We got the transformation done by setting up intensity of other colors as zero.
Converting Images to a 2-D matrix
Handling the third dimension of images sometimes can be complex and redundant. In feature extraction, it becomes much simpler if we compress the image to a 2-D matrix. This is done by Gray-scaling or Binarizing. Gray scaling is richer than Binarizing as it shows the image as a combination of different intensities of Gray. Whereas binarzing simply builds a matrix full of 0s and 1s.
Here is how you convert a RGB image to Gray scale:
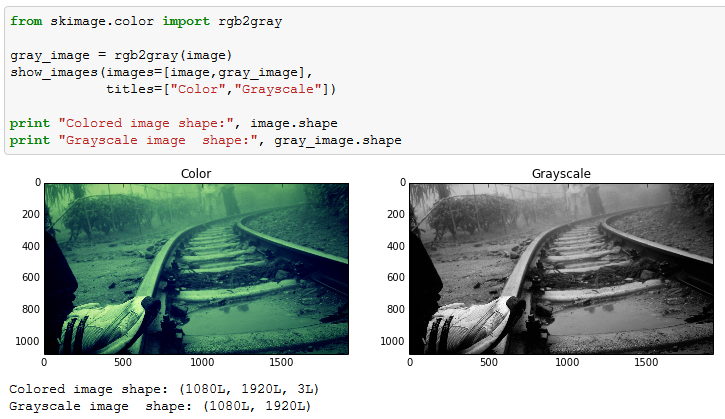
As you can see, the dimension of the image has been reduced to two in Grayscale. However, the features are equally visible in the two images. This is the reason why Grayscale takes much lesser space when stored on Disc.
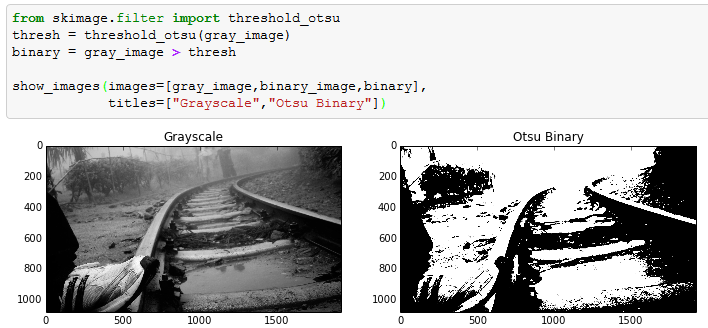
Now let’s try to binarize this Grayscale image. This is done by finding a threshold and flagging the pixels of Grayscale. In this article I have used Otsu’s method to find the threshold. Otsu’s method calculates an “optimal” threshold by maximizing the variance between two classes of pixels, which are separated by the threshold. Equivalently, this threshold minimizes the intra-class variance.
Following is a code to do this transformation:
Blurring an Image
Last part we will cover in this article is more relevant for feature extraction : Blurring of images. Grayscale or binary image sometime captures more than required image and blurring comes very handy in such scenarios. For instance, in this image if the shoe was of lesser interest than the railway track, blurring would have added a lot of value. This will become clear from this example. Blurring algorithm takes weighted average of neighbouring pixels to incorporate surroundings color into every pixel. Following is an example of blurring :
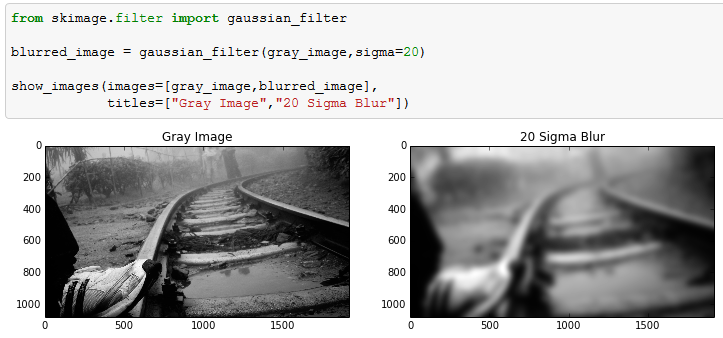
In the above picture, after blurring we clearly see that the shoe has now gone to the same intensity level as that of rail track. Hence, this technique comes in very handy in many scenarios of image processing.
Let’s take a practical example of such application in analytics industry. We wish to count the number of people in a town’s photograph. But this image has a few buildings also. Now the intensity of the people behind the buildings will be lower than building itself. Hence, it becomes difficult for us to count these poeple. Blurring in such scenarios can be done to equalize the intensities of buildings and people in the image.
Complete Code
Here is the complete code :
[stextbox id=”grey”]
image = imread(r"C:\Users\Tavish\Desktop\7.jpg")
show_img(image)
red, yellow =   image.copy(), image.copy()
red[:,:,(1,2)] = 0
yellow[:,:,2]=0
show_images(images=[red,yellow], titles=['Red Intensity','Yellow Intensity'])

from skimage.color import rgb2gray
gray_image = rgb2gray(image)
show_images(images=[image,gray_image],titles=["Color","Grayscale"])
print "Colored image shape:", image.shape
print "Grayscale image shape:", gray_image.shape

from skimage.filter import threshold_otsu
thresh = threshold_otsu(gray_image)
binary = gray_image > thresh
show_images(images=[gray_image,binary_image,binary],titles=["Grayscale","Otsu Binary"])

from skimage.filter import gaussian_filter
blurred_image = gaussian_filter(gray_image,sigma=20)
show_images(images=[gray_image,blurred_image],titles=["Gray Image","20 Sigma Blur"])
[/stextbox]
End Notes
The world of image processing is already so rich that multi-billion dollar companies today rely on these image processing tools for various purposes. These image processing techniques are being used heavily in researches and automization of industry processes. In few of the coming articles we will take a deep dive into feature extraction from an image. This will include detecting corners, segmenting the image, seperating object from the background etc.
Did you find the article useful? Share with us any practical application of image processing you have worked on. Do let us know your thoughts about this article in the box below.
–
P.S. Have you joined Analytics Vidhya Discuss yet? If not, you are missing out on awesome data science discussions. Here are 2 of my best picks among recent discussions:
1. How to do feature selection and transformation?
2. Algorithm for time series forecasting
If you like what you just read & want to continue your analytics learning, subscribe to our emails, follow us on twitter or like our facebook page.
Tavish Srivastava, co-founder and Chief Strategy Officer of Analytics Vidhya, is an IIT Madras graduate and a passionate data-science professional with 8+ years of diverse experience in markets including the US, India and Singapore, domains including Digital Acquisitions, Customer Servicing and Customer Management, and industry including Retail Banking, Credit Cards and Insurance. He is fascinated by the idea of artificial intelligence inspired by human intelligence and enjoys every discussion, theory or even movie related to this idea.