


15 minutes
Introduction
The article covers the use of Generative Adversarial Networks (GAN), an Oversampling technique on real word skewed Covid-19 data in predicting the risk of mortality. This story gives us a better understanding of how data preparation steps like handling imbalanced data will improve our model performance.
The data and the core model for this article are considered from the recent study (July 2020) on “COVID-19 Patient Health Prediction Using Boosted Random Forest Algorithm” by Celestine Iwendi, Ali Kashif Bashir, Atharva Peshkar. et al. This study used the Random Forest algorithm boosted by the AdaBoost model and predicted the mortality of individual patients with 94% accuracy. In this article, the same model and model parameters were considered to clearly analyze the improvement of existing model accuracies by using GAN- based Oversampling Technique.
One of the best ways to learn good practices for aspiring Data Scientist would be participating in hackathons on different forums like Analytics Vidhya, Kaggle, or other. In addition, taking the solved cases and data from these forums or published research publications; understand their methodology, and try to improve accuracy or reduce the error with additional steps. This will form a strong basis and enable us to think deeply for the application of additional techniques we learned across the value chain of data science.
The data used in studies were trained using 222 patient records with 13 features. The data is biased as 159(72%) cases belong to the class `0′ or ‘recovered’. Due to its skewed nature, various undersampling/oversampling techniques can be applied to the data. The problem of skewness data could lead to overfitting of the prediction model. To overcome this limitation many studies have implemented the use of oversampling methods to provide a balance to the dataset, leading to more accurate model training. Oversampling is a technique for compensating the imbalance of a dataset, by increasing the number of samples within the minority data. Conventional methods include Random Oversampling (ROS), Synthetic Minority Oversampling Technique (SMOTE) and others can be applied. For more information on dealing with imbalanced classes using conventional methods, refer to:
Recently, a machine learning model for developing a generative network based on an adversarial learning concept, namely the Generative Adversarial Networks (GAN), has been proposed. The characteristic of Generative Adversarial Networks (GAN) makes it easily applicable to oversampling studies since the nature of the neural network developed based on adversarial training allows artificial data to be made that is similar to the original data. Oversampling based on Generative Adversarial Networks (GAN) overcomes the limitations of conventional methods, such as overfitting, and allows the development of a highly accurate prediction model of imbalanced data.
This article was published as a part of the Data Science Blogathon.
Table of contents
How Does a GAN Generate Synthetic Data?
Two neural networks compete against each other to learn the target distribution and generate artificial data
A generator network G: mimic training samples to fool the discriminator
A discriminator network D: discriminate training samples and generated samples

Generative adversarial networks are based on a game-theoretic scenario in which the generator network must compete against an adversary. As GAN learns to mimic the distribution of data, It is applied in various fields such as music, video, and natural language, and more recently to imbalanced data problems.
The data and the base model used in the study can be found here
import pandas as pd
import numpy as np
import matplotlib.pyplot as plt
import seaborn as sns
import tensorflow as tf
from keras.layers import Input, Dense, Reshape, Flatten, Dropout, BatchNormalization, Embedding
from keras.layers.advanced_activations import LeakyReLU
from keras.layers.merge import concatenate
from keras.models import Sequential, Model
from keras.optimizers import Adam
from keras.utils import to_categorical
from keras.layers.advanced_activations import LeakyReLU
from keras.utils.vis_utils import plot_model
from sklearn.preprocessing import MinMaxScaler, OneHotEncoder, LabelEncoder
import scipy.stats
import datetime as dt
import pydot
import warnings
warnings.filterwarnings("ignore")
%matplotlib inline

df = pd.read_csv('Covid_Train_Oct32020.csv')
df = df.drop('id',axis=1)
df = df.fillna(np.nan,axis=0)
df['age'] = df['age'].fillna(value=df['age'].mean())

df['sym_on'] = pd.to_datetime(df['sym_on'])
df['hosp_vis'] = pd.to_datetime(df['hosp_vis'])
df['sym_on']= df['sym_on'].map(dt.datetime.toordinal)
df['hosp_vis']= df['hosp_vis'].map(dt.datetime.toordinal)
df['diff_sym_hos']= df['hosp_vis'] - df['sym_on']
df=df.drop(['sym_on', 'hosp_vis'], axis=1)
df['location'] = df['location'].astype(str)
df['country'] = df['country'].astype(str)
df['gender'] = df['gender'].astype(str)
df['vis_wuhan'] = df['vis_wuhan'].astype(str)
df['from_wuhan'] = df['from_wuhan'].astype(str)
df['symptom1'] = df['symptom1'].astype(str)
df['symptom2'] = df['symptom2'].astype(str)
df['symptom3'] = df['symptom3'].astype(str)
df['symptom4'] = df['symptom4'].astype(str)
df['symptom5'] = df['symptom5'].astype(str)
df['symptom6'] = df['symptom6'].astype(str)
df.dtypes
Data Description
| Column | Description | Values (for categorical variables) | Type |
| id | Patient Id | NA | Numeric |
| location | The location where the patient belongs to | Multiple cities located throughout the world | String, Categorical |
| country | Patient’s native country | Multiple countries | String, Categorical |
| gender | Patient’s gender | Male, Female | String, Categorical |
| age | Patient’s age | NA | Numeric |
| sym_on | The date patient started noticing the symptoms | NA | Date |
| hosp_vis | Date when the patient visited the hospital | NA | Date |
| vis_wuhan | Whether the patient visited Wuhan, China | Yes (1), No (0) | Numeric, Categorical |
| from_wuhan | Whether the patient belonged to Wuhan, China | Yes (1), No (0) | Numeric, Categorical |
| death | Whether the patient passed away due to COVID-19 | Yes (1), No (0) | Numeric, Categorical |
| Recov | Whether the patient recovered | Yes (1), No (0) | Numeric, Categorical |
| symptom1. symptom2, symptom3, symptom4, symptom5, symptom6 | Symptoms noticed by the patients | Multiple symptoms noticed by the patients | String, Categorical |
The study considered 11 categorical and 2 numeric input features for the analysis. The target variable is death/recovered. A new column”diff_sym_hos” has been populated to provide the day’s difference between the symptoms being noticed and admitted in the hospital. The focus of the study is on improving the minority class data i.e. death==1, a subset is drawn from the train data. The subset is separated as categorical and numeric for and passed to the GAN model.
df_minority_data=df.loc[df['death'] == 1]

#Subsetting input features without target variable
df_minority_data_withouttv=df_minority_data.loc[:, df_minority_data.columns != 'death']
numerical_df = df_minority_data_withouttv.select_dtypes("number")
categorical_df = df_minority_data_withouttv.select_dtypes("object")
scaling = MinMaxScaler()
numerical_df_rescaled = scaling.fit_transform(numerical_df)
get_dummy_df = pd.get_dummies(categorical_df)

#Seperating Each Category
location_dummy_col = [col for col in get_dummy_df.columns if 'location' in col]
location_dummy = get_dummy_df[location_dummy_col]
country_dummy_col = [col for col in get_dummy_df.columns if 'country' in col]
country_dummy = get_dummy_df[country_dummy_col]
gender_dummy_col = [col for col in get_dummy_df.columns if 'gender' in col]
gender_dummy = get_dummy_df[gender_dummy_col]
vis_wuhan_dummy_col = [col for col in get_dummy_df.columns if 'vis_wuhan' in col]
vis_wuhan_dummy = get_dummy_df[vis_wuhan_dummy_col]
from_wuhan_dummy_col = [col for col in get_dummy_df.columns if 'from_wuhan' in col]
from_wuhan_dummy = get_dummy_df[from_wuhan_dummy_col]
symptom1_dummy_col = [col for col in get_dummy_df.columns if 'symptom1' in col]
symptom1_dummy = get_dummy_df[symptom1_dummy_col]
symptom2_dummy_col = [col for col in get_dummy_df.columns if 'symptom2' in col]
symptom2_dummy = get_dummy_df[symptom2_dummy_col]
symptom3_dummy_col = [col for col in get_dummy_df.columns if 'symptom3' in col]
symptom3_dummy = get_dummy_df[symptom3_dummy_col]
symptom4_dummy_col = [col for col in get_dummy_df.columns if 'symptom4' in col]
symptom4_dummy = get_dummy_df[symptom4_dummy_col]
symptom5_dummy_col = [col for col in get_dummy_df.columns if 'symptom5' in col]
symptom5_dummy = get_dummy_df[symptom5_dummy_col]
symptom6_dummy_col = [col for col in get_dummy_df.columns if 'symptom6' in col]
symptom6_dummy = get_dummy_df[symptom6_dummy_col]

| Column | Description | Values (for categorical variables) | Type |
| id | Patient Id | NA | Numeric |
| location | The location where the patient belongs to | Multiple cities located throughout the world | String, Categorical |
| country | Patient’s native country | Multiple countries | String, Categorical |
| gender | Patient’s gender | Male, Female | String, Categorical |
| age | Patient’s age | NA | Numeric |
| sym_on | The date patient started noticing the symptoms | NA | Date |
| hosp_vis | Date when the patient visited the hospital | NA | Date |
| vis_wuhan | Whether the patient visited Wuhan, China | Yes (1), No (0) | Numeric, Categorical |
| from_wuhan | Whether the patient belonged to Wuhan, China | Yes (1), No (0) | Numeric, Categorical |
| death | Whether the patient passed away due to COVID-19 | Yes (1), No (0) | Numeric, Categorical |
| Recov | Whether the patient recovered | Yes (1), No (0) | Numeric, Categorical |
| symptom1. symptom2, symptom3, symptom4, symptom5, symptom6 | Symptoms noticed by the patients | Multiple symptoms noticed by the patients | String, Categorical |
Defining the Generator
The generator takes input from latent space and generates new synthetic samples. The leaky rectified linear activation unit (LeakyReLU) is a good practice to use in both the generator and the discriminator model for handling some negative values. It is used with the default recommended value of 0.2 and the appropriate weight initializer “he_uniform”. Additionally, batch normalization is used across different layers to standardize the activations (zero mean and unit variance) from a prior layer and stabilize the training process.
In the output layer, the softmax activation function is used for categorical variables and sigmoid is used for continuous variables.
def define_generator (catsh1,catsh2,catsh3,catsh4,catsh5,catsh6,catsh7,catsh8,catsh9,catsh10,catsh11,numerical):
  #Inputting noise  from latent space
    noise = Input(shape = (70,))
    hidden_1 = Dense(8, kernel_initializer = "he_uniform")(noise)
    hidden_1 = LeakyReLU(0.2)(hidden_1)
    hidden_1 = BatchNormalization(momentum = 0.8)(hidden_1)
    hidden_2 = Dense(16, kernel_initializer = "he_uniform")(hidden_1)
    hidden_2 = LeakyReLU(0.2)(hidden_2)
    hidden_2 = BatchNormalization(momentum = 0.8)(hidden_2)

    #Branch 1 for generating location data

    branch_1 = Dense(32, kernel_initializer = "he_uniform")(hidden_2)
    branch_1 = LeakyReLU(0.2)(branch_1)
    branch_1 = BatchNormalization(momentum = 0.8)(branch_1)
    branch_1 = Dense(64, kernel_initializer = "he_uniform")(branch_1)
    branch_1 = LeakyReLU(0.2)(branch_1)
    branch_1 = BatchNormalization(momentum=0.8)(branch_1)

    #Output Layer1
    branch_1_output = Dense(catsh1, activation = "softmax")(branch_1)

    #Likewise, for all remaining 10 categories branches will be defined
    #Branch 12 for generating numerical data
    branch_12 = Dense(64, kernel_initializer = "he_uniform")(hidden_2)
    branch_12 = LeakyReLU(0.2)(branch_3)
    branch_12 = BatchNormalization(momentum=0.8)(branch_12)
    branch_12 = Dense(128, kernel_initializer = "he_uniform")(branch_12)
    branch_12 = LeakyReLU(0.2)(branch_12)
    branch_12 = BatchNormalization(momentum=0.8)(branch_12)

    #Output Layer12
    branch_12_output = Dense(numerical, activation = "sigmoid")(branch_12)

    #Combined output
    combined_output = concatenate([branch_1_output, branch_2_output, branch_3_output,branch_4_output,branch_5_output,branch_6_output,branch_7_output,branch_8_output,branch_9_output,branch_10_output,branch_11_output,branch_12_output])

    #Return model

    return Model(inputs = noise, outputs = combined_output)


generator = define_generator(location_dummy.shape[1],country_dummy.shape[1],gender_dummy.shape[1],vis_wuhan_dummy.shape[1],from_wuhan_dummy.shape[1],symptom1_dummy.shape[1],symptom2_dummy.shape[1],symptom3_dummy.shape[1],symptom4_dummy.shape[1],symptom5_dummy.shape[1],symptom6_dummy.shape[1],numerical_df_rescaled.shape[1])
generator.summary()
Defining the Discriminator
The discriminator model will take a sample from our data, such as a vector, and output a classification prediction as to whether the sample is real or fake. This is a binary classification problem, so sigmoid activation is used in the output layer and binary cross-entropy loss function is used in model compilation. The Adam optimization algorithm with the learning rate LR of 0.0002 and the recommended beta1 momentum value of 0.5 is used.
def define_discriminator(inputs_n):
    #Input from generator
    d_input = Input(shape = (inputs_n,))
    d = Dense(128, kernel_initializer="he_uniform")(d_input)
    d = LeakyReLU(0.2)(d)
    d = Dense(64, kernel_initializer="he_uniform")(d)
    d = LeakyReLU(0.2)(d)
    d = Dense(32, kernel_initializer="he_uniform")(d)
    d = LeakyReLU(0.2)(d)
    d = Dense(16, kernel_initializer="he_uniform")(d)
    d = LeakyReLU(0.2)(d)
    d = Dense(8, kernel_initializer="he_uniform")(d)
    d = LeakyReLU(0.2)(d)

    #Output Layer
    d_output = Dense(1, activation = "sigmoid")(d)

    #compile and return model
    model = Model(inputs = d_input, outputs = d_output)
    model.compile(loss = "binary_crossentropy", optimizer = Adam(lr=0.0002, beta_1=0.5), metrics = ["accuracy"])
    return model


inputs_n = location_dummy.shape[1]+country_dummy.shape[1]+gender_dummy.shape[1]+vis_wuhan_dummy.shape[1]+from_wuhan_dummy.shape[1]+symptom1_dummy.shape[1]+symptom2_dummy.shape[1]+symptom3_dummy.shape[1]+symptom4_dummy.shape[1]+symptom5_dummy.shape[1]+symptom6_dummy.shape[1]+numerical_df_rescaled.shape[1]
discriminator = define_discriminator(inputs_n)
discriminator.summary()
Combining generator and discriminator together as a GAN model and completing the training. Considered 7,000 epoch’s and considered a complete batch of minority class data for training.
Def define_complete_gan(generator, discriminator):
    discriminator.trainable = False
    gan_output = discriminator(generator.output)

    #Initialize gan
    model = Model(inputs = generator.input, outputs = gan_output)

    #Model Compilation
    model.compile(loss = "binary_crossentropy", optimizer = Adam(lr=0.0002, beta_1=0.5))
    return model

completegan = define_complete_gan(generator, discriminator)

def gan_train(gan, generator, discriminator, catsh1,catsh2,catsh3,catsh4,catsh5,catsh6,catsh7,catsh8,catsh9,catsh10,catsh11,numerical, latent_dim, n_epochs, n_batch, n_eval):
    #Upddte Discriminator with half batch size
    half_batch = int(n_batch / 2)
    discriminator_loss = []
    generator_loss = []
    #generate class labels for fake and real
    valid = np.ones((half_batch, 1))
    y_gan = np.ones((n_batch, 1))
    fake = np.zeros((half_batch, 1))

    #training
    for i in range(n_epochs):
        #select random batch from real categorical and numerical data
        idx = np.random.randint(0, catsh1.shape[0], half_batch)
        location_real = catsh1[idx]
        country_real = catsh2[idx]
        gender_real = catsh3[idx]
        vis_wuhan_real = catsh4[idx]
        from_wuhan_real = catsh5[idx]
        symptom1_real = catsh6[idx]
        symptom2_real = catsh7[idx]
        symptom3_real = catsh8[idx]
        symptom4_real = catsh9[idx]
        symptom5_real = catsh10[idx]
        symptom6_real = catsh11[idx]
        numerical_real = numerical_df_rescaled[idx]

        #concatenate categorical and numerical data for the discriminator
        real_data = np.concatenate([location_real, country_real, gender_real,vis_wuhan_real,from_wuhan_real,symptom1_real,symptom2_real,symptom3_real,symptom4_real,symptom5_real,symptom6_real,numerical_real], axis = 1)

        #generate fake samples from the noise
        noise = np.random.normal(0, 1, (half_batch, latent_dim))
        fake_data = generator.predict(noise)

        #train the discriminator and return losses and acc
        d_loss_real, da_real = discriminator.train_on_batch(real_data, valid)
        d_loss_fake, da_fake = discriminator.train_on_batch(fake_data, fake)
        d_loss = 0.5 * np.add(d_loss_real, d_loss_fake)
        discriminator_loss.append(d_loss)

        #generate noise for generator input and train the generator (to have the discriminator label samples as valid)
        noise = np.random.normal(0, 1, (n_batch, latent_dim))
        g_loss = gan.train_on_batch(noise, y_gan)
        generator_loss.append(g_loss)

        #evaluate progress
        if (i+1) % n_eval == 0:
            print ("Epoch: %d [Discriminator loss: %f] [Generator loss: %f]" % (i + 1, d_loss, g_loss))

    plt.figure(figsize = (20, 10))
    plt.plot(generator_loss, label = "Generator loss")
    plt.plot(discriminator_loss, label = "Discriminator loss")
    plt.title("Stats from training GAN")
    plt.grid()
    plt.legend()

latent_dim = 100
gan_train(completegan, generator, discriminator, location_dummy.values,country_dummy.values,gender_dummy.values,vis_wuhan_dummy.values,from_wuhan_dummy.values,symptom1_dummy.values,symptom2_dummy.values,symptom3_dummy.values,symptom4_dummy.values,symptom5_dummy.values,symptom6_dummy.values,numerical_df_rescaled, latent_dim, n_epochs = 7000, n_batch = 63, n_eval = 200)

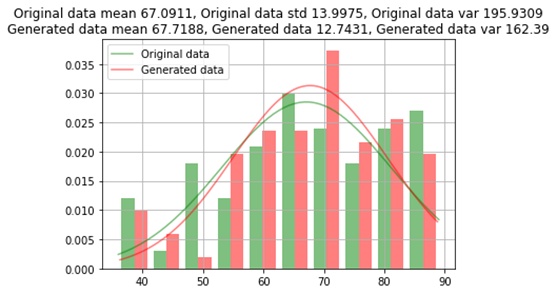
The trained model is used for generating additional 96 records of a minority class to make an equal split (159) of each class. Now comparing generated numeric data with original data mean, standard deviation, and variance; and categorical data are compared on the basis of the count of each category.
noise = np.random.normal(0, 1, (96, 100))
generated_mixed_data = generator.predict(noise)
columns=list(location_dummy.columns)+list(country_dummy.columns)+list(gender_dummy.columns)+list(vis_wuhan_dummy.columns)+list(from_wuhan_dummy.columns)+list(symptom1_dummy.columns)+list(symptom2_dummy.columns)+list(symptom3_dummy.columns)+list(symptom4_dummy.columns)+list(symptom5_dummy.columns)+list(symptom6_dummy.columns)+list(numerical_df.columns)
mixed_gen_df = pd.DataFrame(data = generated_mixed_data, columns = columns)
mixed_gen_df.iloc[:,:-3] = np.round(mixed_gen_df.iloc[:,:-3])
mixed_gen_df.iloc[:,-2:] = scaling.inverse_transform(mixed_gen_df.iloc[:,-2:])

#Original Data
original_df = pd.concat([location_dummy,country_dummy,gender_dummy,vis_wuhan_dummy,from_wuhan_dummy,symptom1_dummy,symptom2_dummy,symptom3_dummy,symptom4_dummy,symptom5_dummy,symptom6_dummy,numerical_df], axis = 1)
def normal_distribution(org, noise):
    org_x = np.linspace(org.min(), org.max(), len(org))
    noise_x = np.linspace(noise.min(), noise.max(), len(noise))
    org_y = scipy.stats.norm.pdf(org_x, org.mean(), org.std())
    noise_y = scipy.stats.norm.pdf(noise_x, noise.mean(), noise.std())
    n, bins, patches = plt.hist([org, noise], density = True, alpha = 0.5, color = ["green", "red"])
    xmin, xmax = plt.xlim()
    plt.plot(org_x, org_y, color = "green", label = "Original data", alpha = 0.5)
    plt.plot(noise_x, noise_y, color = "red", label = "Generated data", alpha = 0.5)
    title = f"Original data mean {np.round(org.mean(), 4)}, Original data std {np.round(org.std(), 4)}, Original data var {np.round(org.var(), 4)}\nGenerated data mean {np.round(noise.mean(), 4)}, Generated data {np.round(noise.std(), 4)}, Generated data var {np.round(noise.var(), 2)}"
    plt.title(title)
    plt.legend()
    plt.grid()
    plt.show()

Numeric_columns=numerical_df.columns

for column in numerical_df.columns:
    print(column, "Comparison between Original Data and Generated Data")
    normal_distribution(original_df[column], mixed_gen_df[column])
Age Comparison Between Original Data and Generated Data
Diff_sym_hos Comparison between Original Data and Generated Data Comparison between Original Data and Generated Data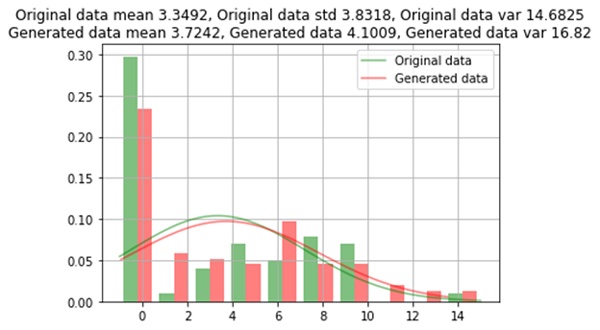
Random Categories Comparison between Original Data and Generated Data Comparison between Original Data and Generated Data
| Feature | Original Data | Generated Data | ||
| 0 | 1 | 0 | 1 | |
| location_Hokkaido | 61 | 2 | 95 | 1 |
| gender_female | 49 | 14 | 60 | 36 |
| symptom2_ cough | 62 | 1 | 96 | 0 |
The data generated from the GAN oversampling method is almost similar to the original data which has an error of approximately 1%. For a few rare categories, data is not generated across all category values.
Following the same data preparation steps as mentioned in the original study to see how model performance has increased from the original methodology by using GAN oversampling. One hot coded data of the generated sample is converted to the original data frame format.
# Getting Back Categorical Data in Original_Format from Dummies
location_filter_col = [col for col in mixed_gen_df if col.startswith('location')]
location=mixed_gen_df[location_filter_col]
location= pd.get_dummies(location).idxmax(1)
location= location.replace('location_', '', regex=True)
df_generated_data = pd.DataFrame()
df_generated_data['location']=location

country_filter_col = [col for col in mixed_gen_df if col.startswith('country')]
country=mixed_gen_df[country_filter_col]
country= pd.get_dummies(country).idxmax(1)
country= country.replace('country_', '', regex=True)
df_generated_data['country']=country

gender_filter_col = [col for col in mixed_gen_df if col.startswith('gender')]
gender=mixed_gen_df[gender_filter_col]
gender= pd.get_dummies(gender).idxmax(1)
gender= gender.replace('gender_', '', regex=True)
df_generated_data['gender']=gender

vis_wuhan_filter_col = [col for col in mixed_gen_df if col.startswith('vis_wuhan')]
vis_wuhan=mixed_gen_df[vis_wuhan_filter_col]
vis_wuhan= pd.get_dummies(vis_wuhan).idxmax(1)
vis_wuhan= vis_wuhan.replace('vis_wuhan_', '', regex=True)
df_generated_data['vis_wuhan']=vis_wuhan

from_wuhan_filter_col = [col for col in mixed_gen_df if col.startswith('from_wuhan')]
from_wuhan=mixed_gen_df[from_wuhan_filter_col]
from_wuhan= pd.get_dummies(from_wuhan).idxmax(1)
from_wuhan= from_wuhan.replace('from_wuhan_', '', regex=True)
df_generated_data['from_wuhan']=from_wuhan

symptom1_filter_col = [col for col in mixed_gen_df if col.startswith('symptom1')]
symptom1=mixed_gen_df[symptom1_filter_col]
symptom1= pd.get_dummies(symptom1).idxmax(1)
symptom1= symptom1.replace('symptom1_', '', regex=True)
df_generated_data['symptom1']=symptom1

symptom2_filter_col = [col for col in mixed_gen_df if col.startswith('symptom2')]
symptom2=mixed_gen_df[symptom2_filter_col]
symptom2= pd.get_dummies(symptom2).idxmax(1)
symptom2= symptom2.replace('symptom2_', '', regex=True)
df_generated_data['symptom2']=symptom2

symptom3_filter_col = [col for col in mixed_gen_df if col.startswith('symptom3')]
symptom3=mixed_gen_df[symptom3_filter_col]
symptom3= pd.get_dummies(symptom3).idxmax(1)
symptom3= symptom3.replace('symptom3_', '', regex=True)
df_generated_data['symptom3']=symptom3

symptom4_filter_col = [col for col in mixed_gen_df if col.startswith('symptom4')]
symptom4=mixed_gen_df[symptom4_filter_col]
symptom4= pd.get_dummies(symptom4).idxmax(1)
symptom4= symptom4.replace('symptom4_', '', regex=True)
df_generated_data['symptom4']=symptom4

symptom5_filter_col = [col for col in mixed_gen_df if col.startswith('symptom5')]
symptom5=mixed_gen_df[symptom5_filter_col]
symptom5= pd.get_dummies(symptom5).idxmax(1)
symptom5= symptom5.replace('symptom5_', '', regex=True)
df_generated_data['symptom5']=symptom5

symptom6_filter_col = [col for col in mixed_gen_df if col.startswith('symptom6')]
symptom6=mixed_gen_df[symptom6_filter_col]
symptom6= pd.get_dummies(symptom6).idxmax(1)
symptom6= symptom6.replace('symptom6_', '', regex=True)
df_generated_data['symptom6']=symptom6

df_generated_data['death']=1
df_generated_data['death']=1

df_generated_data[['age','diff_sym_hos']]=mixed_gen_df[['age','diff_sym_hos']]
df_generated_data = df_generated_data.fillna(np.nan,axis=0)

#Encoding Data
encoder_location = preprocessing.LabelEncoder()
encoder_country = preprocessing.LabelEncoder()
encoder_gender = preprocessing.LabelEncoder()
encoder_symptom1 = preprocessing.LabelEncoder()
encoder_symptom2 = preprocessing.LabelEncoder()
encoder_symptom3 = preprocessing.LabelEncoder()
encoder_symptom4 = preprocessing.LabelEncoder()
encoder_symptom5 = preprocessing.LabelEncoder()
encoder_symptom6 = preprocessing.LabelEncoder()

# Loading and Preparing Data
df = pd.read_csv('Covid_Train_Oct32020.csv')
df = df.drop('id',axis=1)
df = df.fillna(np.nan,axis=0)
df['age'] = df['age'].fillna(value=tdata['age'].mean())
df['sym_on'] = pd.to_datetime(df['sym_on'])
df['hosp_vis'] = pd.to_datetime(df['hosp_vis'])
df['sym_on']= df['sym_on'].map(dt.datetime.toordinal)
df['hosp_vis']= df['hosp_vis'].map(dt.datetime.toordinal)
df['diff_sym_hos']= df['hosp_vis'] - df['sym_on']
df = df.drop(['sym_on','hosp_vis'],axis=1)

df['location'] = encoder_location.fit_transform(df['location'].astype(str))
df['country'] = encoder_country.fit_transform(df['country'].astype(str))
df['gender'] = encoder_gender.fit_transform(df['gender'].astype(str))
df[['symptom1']] = encoder_symptom1.fit_transform(df['symptom1'].astype(str))
df[['symptom2']] = encoder_symptom2.fit_transform(df['symptom2'].astype(str))
df[['symptom3']] = encoder_symptom3.fit_transform(df['symptom3'].astype(str))
df[['symptom4']] = encoder_symptom4.fit_transform(df['symptom4'].astype(str))
df[['symptom5']] = encoder_symptom5.fit_transform(df['symptom5'].astype(str))
df[['symptom6']] = encoder_symptom6.fit_transform(df['symptom6'].astype(str))

# Encoding Generated Data
df_generated_data['location'] = encoder_location.transform(df_generated_data['location'].astype(str))
df_generated_data['country'] = encoder_country.transform(df_generated_data['country'].astype(str))
df_generated_data['gender'] = encoder_gender.transform(df_generated_data['gender'].astype(str))
df_generated_data[['symptom1']] = encoder_symptom1.transform(df_generated_data['symptom1'].astype(str))
df_generated_data[['symptom2']] = encoder_symptom2.transform(df_generated_data['symptom2'].astype(str))
df_generated_data[['symptom3']] = encoder_symptom3.transform(df_generated_data['symptom3'].astype(str))
df_generated_data[['symptom4']] = encoder_symptom4.transform(df_generated_data['symptom4'].astype(str))
df_generated_data[['symptom5']] = encoder_symptom5.transform(df_generated_data['symptom5'].astype(str))
df_generated_data[['symptom6']] = encoder_symptom6.transform(df_generated_data['symptom6'].astype(str))
df_generated_data[['diff_sym_hos']] = df_generated_data['diff_sym_hos'].astype(int)
Model Comparison
After splitting the original data into train and test, generated data from GAN is added to the train data to compare the performance with the base model. The model performance is tested on the actual (original) split test data.
from sklearn.metrics import recall_score as rs
from sklearn.metrics import precision_score as ps
from sklearn.metrics import f1_score as fs
from sklearn.metrics import balanced_accuracy_score as bas
from sklearn.metrics import confusion_matrix as cm
import numpy as np
import pandas as pd
import datetime as dt
import sklearn
from scipy import stats
from sklearn import preprocessing
from sklearn.model_selection import GridSearchCV
from sklearn.ensemble import RandomForestClassifier
from sklearn.ensemble import AdaBoostClassifier
from sklearn.model_selection import train_test_split
from sklearn.metrics import recall_score as rs
from sklearn.metrics import precision_score as ps
from sklearn.metrics import f1_score as fs
from sklearn.metrics import log_loss

rf = RandomForestClassifier(bootstrap=True, ccp_alpha=0.0, class_weight=None,
criterion='gini', max_depth=2, max_features='auto',
max_leaf_nodes=None, max_samples=None,
min_impurity_decrease=0.0, min_impurity_split=None,
min_samples_leaf=2, min_samples_split=2,
min_weight_fraction_leaf=0.0, n_estimators=100,
n_jobs=None, oob_score=False, random_state=None,
verbose=0, warm_start=False)
classifier = AdaBoostClassifier(rf,50,0.01,'SAMME.R',10)

#Seperate TV in Generated Data
X1 = df_generated_data.loc[:, df_generated_data.columns != 'death']
Y1 = df_generated_data['death']

#Seperate TV in Original Data
X = df.loc[:, df.columns != 'death']
Y = df['death']

#Splitting Original Data
X_train, X_test, Y_train, Y_test = train_test_split(X,Y,test_size=0.2,random_state=0)

#Appending Generated Data to X_train
X_train1=X_train.append(X1, sort=False)
Y_train1=Y_train.append(Y1)
classifier.fit(X_train1,np.array(Y_train1).reshape(Y_train1.shape[0],1))
pred = np.array(classifier.predict(X_test))

recall = rs(Y_test,pred)
precision = ps(Y_test,pred)
r1 = fs(Y_test,pred)
ma = classifier.score(X_test,Y_test)
print('*** Evaluation metrics for test dataset ***\n')
print('Recall Score: ',recall)
print('Precision Score: ',precision)
print('F1 Score: ',f1)
print('Accuracy: ',ma)
| Metric | Score of Base Model* | Score with Augmented Generated Data |
| Recall Score | 0.75 | 0.83 |
| Precision Score | 1 | 1 |
| F1 Score | 0.86 | 0.9 |
| Accuracy | 0.9 | 0.95 |
| *Source: Table 3 Base Model Metrics |
Conclusion
The proposed model provides a more accurate and robust result compared to that of the based model, showing that GAN-based oversampling overcomes the limitations of the imbalanced data, and it appropriately inflates the minority class.
Frequently Asked Questions
A. A Generative Adversarial Network (GAN) is a network that consists of a generator and a discriminator. The generator generates plausible data, while the discriminator distinguishes between real data and the data generated by the generator.
A. The oversampling technique is used in Generative Adversarial Networks (GANs) when the amount of collected or available data (sample size) is insufficient.