Introduction
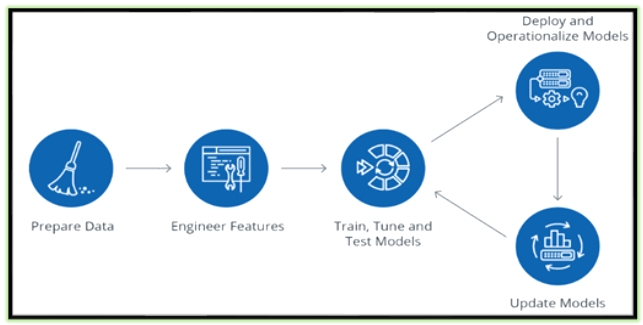
Data Science Lifecycle revolves around using various analytical methods to produce insights and followed by applying Machine Learning Techniques, to do predictions from the collected data from various sources, through that we could achieve major and innovative objectives, challenges and value added solutions for certain business problem statements. The entire process involves several steps like data cleaning, preparation, modelling, model evaluation, etc.
We can segregate the Data Science Life Cycle in % wise as below in the pie chart., So that we could understand better way, how each stage is playing important roles to build the model for prediction or classification.
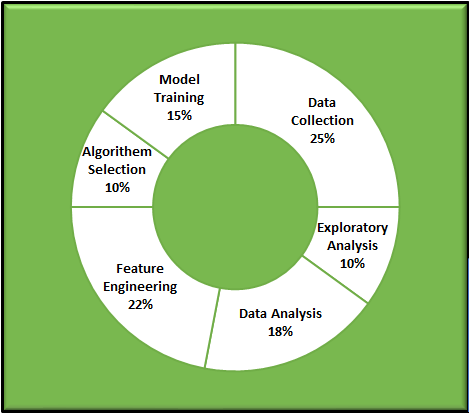
Based on the nature of the Data and its source, there might be a few changes in %, So it is not necessarily to be stick with this pattern. Hope you understand my point.
What is called Feature(s) in Data Science/Machine Learning? (Try to understand first)
- The FEATURE is nothing but the character or a set of characteristics of a given Dataset.
- Simply saying that the given columns/fields/attributes in the given dataset, When these columns/fields/characteristics are converted into some measurable form I mean, as Numeric, then they are called as features.
- Mostly Numeric data type is columns/fields/attributes are straight features for the analysis.
- Sometimes Characters/String/another non-numeric type also converted into measurable form (Numeric) to analyze the given dataset.
Why we should understand the Feature of the dataset?
Once we understand the nature of the feature engineering process of the given dataset. We are able to extract notable information, insights as mentioned earlier. Absolutely that would help us to use the right algorithms to build the perfect model for the given problem statement and to achieve a successful model.
4W-1H of Feature Engineering
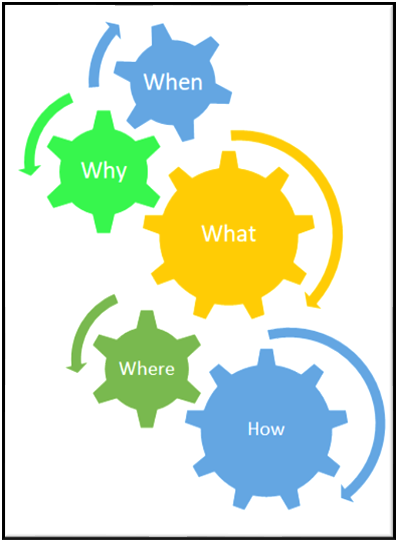
What is Feature Engineering?
- It is one of the major processes in the Data Science/Machine Learning life cycle. Here we’re transforming the given data into a reasonable form that is easier to interpret.
- Making data more transparent to helping the Machine Learning Model
- Creating new features to enhance the model.
Why is Feature Engineering?
- NUMBER OF FEATURES significantly could impact the model considerably, So that feature engineering is an important task in the Data Science life cycle.
- Certainly, FE is IMPROVING THE PERFORMANCE of machine learning models
Where and When is Feature Engineering?
- When we have a LOT OF FEATURES in the given dataset, feature engineering can become quite challenge and interesting
too. - The number of features could significantly impact the model considerably, So that feature engineering is an important task in Data
Science life cycle.
Feature Improvements – Scaling
Under Feature Improvements, We are having so many things to discuss, Here I am picking just Scaling since this involves mathematics and statistics.
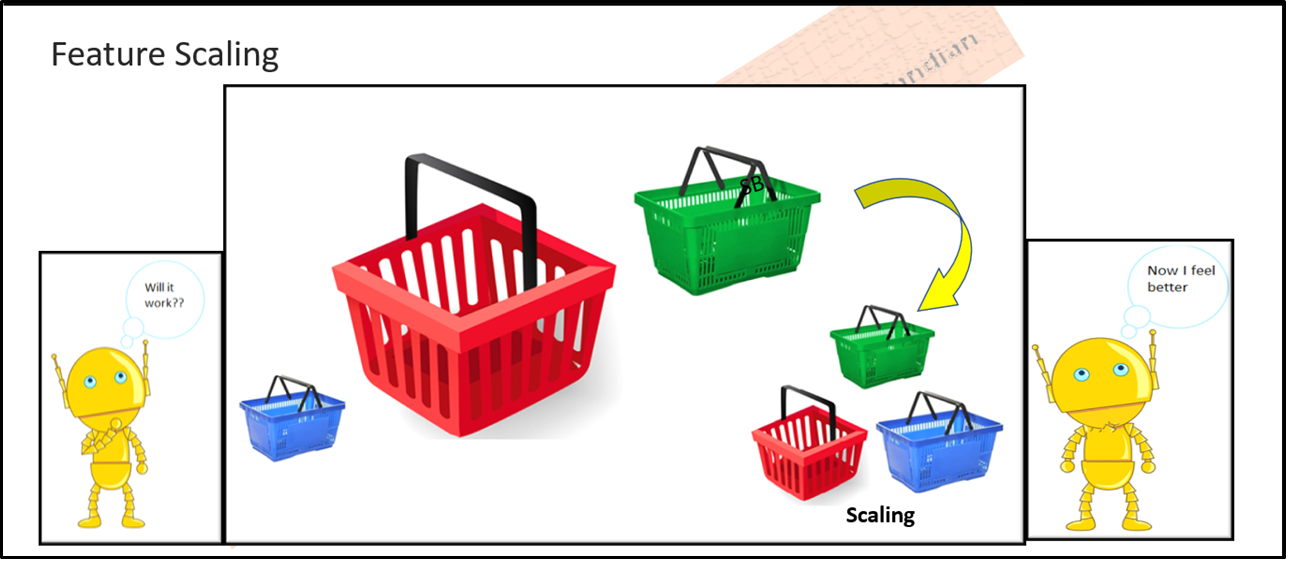
Before applying Machine Learning algorithms to the dataset, We have to carefully understand the magnitude of all key features, which is applicable for feature selection and finding independent and dependent variables. So we have to, scaling them accordingly to accommodate for the analysis and model preparations, the process of adjusting the magnitude of these features is SCALING or Feature Scaling.
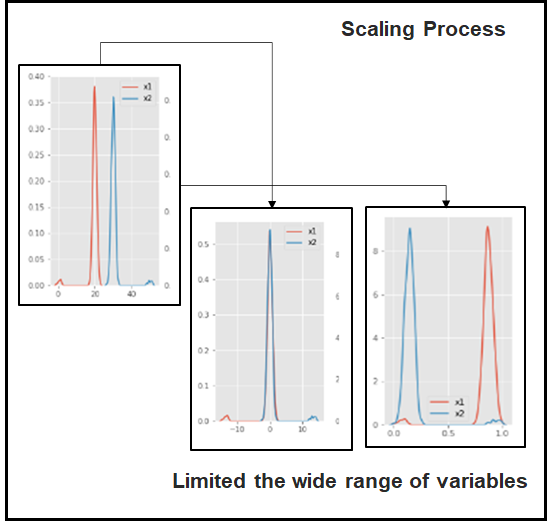
Scaling is an important approach that allows us to limit the wide range of variables in the feature under the certain mathematical approach
- Standard Scalar
- Min-Max Scalar
- Robust Scalar
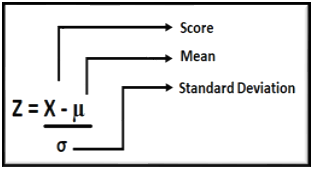
StandardScaler: Standardizes a feature by subtracting the mean and then scaling to unit variance. Unit variance means dividing all the values by the standard
deviation. StandardScaler makes the mean of the distribution 0. About 68% of the values will lie between -1 and 1.
MinMaxScaler/Normalization: Will transform each value in the column proportionally within the range [0,1].Use this as the first scaler choice to transform a feature, as it will preserve the shape of the dataset (no distortion).

Scaling Process
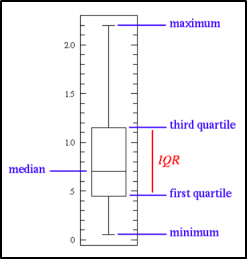
Robust Scalar: Robust Scalar is specifically to handle the outliers. Since other scaling methods are not supported effectively. This method removes the median and scales the data according to the QUANTILE RANGE, from defaults to IQR: Interquartile Range. (Range è 25% – 75%)
The IQR is the range – 1st quartile (25th quantile) and the 3rd quartile (75th quantile). We could see the outliers themselves are still present in the transformed data set.
Code Samples
Standard Scaler
Min-Max Scaler
import numpy as np
from sklearn import preprocessing
data1 = np.array([[-100.3],
[27.5],
[0],
[-200.9],
[1000]])
print('Before scalingn',data1)
minmax_scale = preprocessing.MinMaxScaler(feature_range=(1, 2))
scaled = minmax_scale.fit_transform(data1)
print('nAfter Min-Max Scalern',scaled)
Before scaling
 [[-100.3]
 [  27.5]
 [   0. ]
 [-200.9]
 [1000. ]]

After Min-Max Scaler
 [[1.08377051]
 [1.19019069]
 [1.1672912 ]
 [1.        ]
 [2.        ]]
Robust Scaler
import numpy as np
from sklearn import preprocessing
data1 = np.array([[-100.3],
[27.5],
[0],
[-200.9],
[1000]])
print('Before Scalingn',data1)
robust_scaler = preprocessing.RobustScaler()
scaled = robust_scaler.fit_transform(data1)
print('n After Robust Scalern',scaled)
Before Scaling
 [[-100.3]
 [  27.5]
 [   0. ]
 [-200.9]
 [1000. ]]

 After Robust Scaler
 [[-0.78482003]
 [ 0.21517997]
 [ 0.        ]
 [-1.57198748]
 [ 7.82472613]]
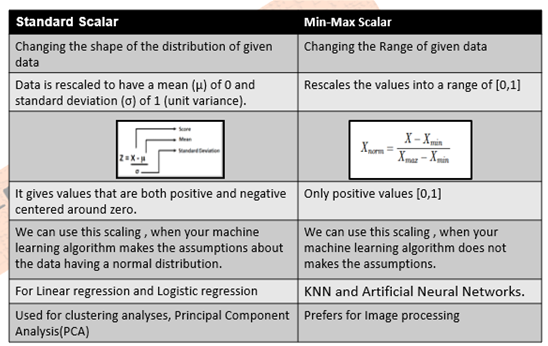
Quick Comparison (StandardScaler MinMaxScaler/Normalization)
Feature Engineering itself very vast area, and Feature Improvements, is a subdivision of Feature Engineering and Scaling in a small portion. So try to understand how this topic is very important for Data Scientist and Machine Learning Engineers. Will discuss more in upcoming blogs!


