Introduction
Behind any country’s development in several sectors like agriculture, mining industry, etc. are highly rely upon remote sensing data. Remote sensing data are nothing but the data obtained using remote sensing technologies like high-quality cameras on satellites or airplanes, sonar systems in ships. The growth of technology in the field of remote sensing has been exponential. The images are captured by the high-quality camera contains a huge amount of data and by analyzing those data crucial decisions are taken. Unlike RGB images these images consist of more than 3 bands.
Other than RGB, mainly there are two more types of images and they are Multispectral (4-100 bands) and Hyperspectral Images (more than 100 bands). In this article, my focus will be more on the Hyperspectral Images. In Hyperspectral Images, each spectrum or band carries some important data, hence denoising becomes a very crucial part of preprocessing.
Noise in Hyperspectral Images
When these Hyperspectral Images are captured some noises are get added. Mainly this noise is caused by sensors or the environment. The presence of noise degrades the quality of the image and decreases the accuracy of the interpretation of hyperspectral images. There are several algorithms to denoise the hyperspectral images. Here I am going to discuss the discrete wavelet transform(dwt) technique for denoising the image.
Wavelets
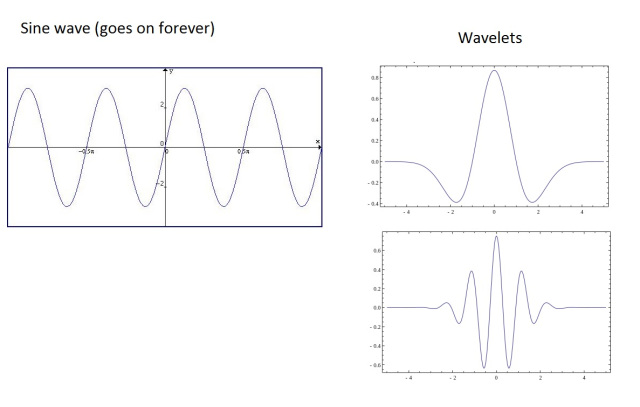
Fig 1: Wave vs Wavelet [1]
Before going into the discussion of the discrete wavelet transform, let’s understand what is wavelet. A wavelet is a rapidly decaying, wave-like oscillation that has zero mean. Unlike sinusoids, which extend to infinity, a wavelet exists for a finite duration. A signal or a function f(t) can often be better analyzed if it is expanded as

the function in the equation represents the wavelet expansion functions, and j,k is the scaling and shifting parameters respectively. [2]
Discrete wavelet transform
The wavelet can be constructed from a scaling function that describes its scaling properties. The restriction that the scaling functions must be orthogonal to their discrete translations implies some mathematical conditions on them which are mentioned everywhere e. g. the dilation equation

where S is a scaling factor (usually chosen as 2). Moreover, the area between the function must be normalized and the scaling function must be orthogonal to its integer translates e. g.

After introducing some more conditions (as the restrictions above do not produce a unique solution) we can obtain results of all these equations, e. g. a finite set of coefficients a_k which define the scaling function and also the wavelet. The wavelet is obtained from the scaling function as:

where N is an even integer. The set of wavelets then forms an orthonormal basis which we use to decompose signal. [3]
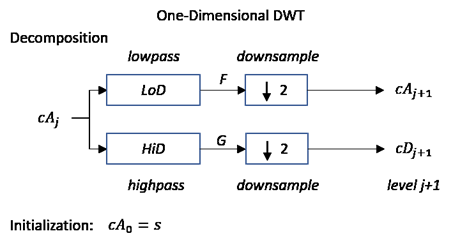
Fig 2: 1D DWT [4]
Single Level Decomposition
Here, according to fig 4, the data of a signal s(t) is cA. It is passed through two different filters: High pass filter and low pass filter. These are not normal filters for signal processing. These filters will generate wavelet coefficients. According to the Nyquist theorem, the data will be upsampled by 2. The two types of wavelet coefficients will consist of high frequency and low-frequency data. These two wavelet coefficients are Detailed Coefficients (cD) and Approximation Coefficients (cA).
Multilevel Decomposition
Though single-level decomposition is enough to detect edges which is helpful to extract features for image processing, Multilevel decomposition provides the means of best compressing data. Especially, in the case of images with added noise, at the first level of decomposition, the edges are being detected but it can be hardly recognized but as the no of levels are increased the subsequent levels will
contain more useful data with less noise.
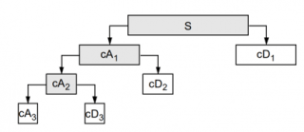
Fig 3: Wavelet Decomposition tree [5]
Here the data of signal s(t) is decomposed up to level 3. The approximation coefficient at level 1 is further decomposed. cA1 is passed through two filters (high pass and low pass) and in level 2 another two coefficients are being generated. In this way, up to a certain level, the decomposition can be done. The max level is Log2N where N is the length of the data.
Reconstruction
The signal or image decomposition is known as signal/image analysis. After the decomposition, the next step is a reconstruction which is known as signal/image synthesis. In the reconstruction phase, both the detailed coefficients and the approximation coefficients are upsampled and the first one passed through the high-frequency filter whereas the latter one passed the less frequency filter.
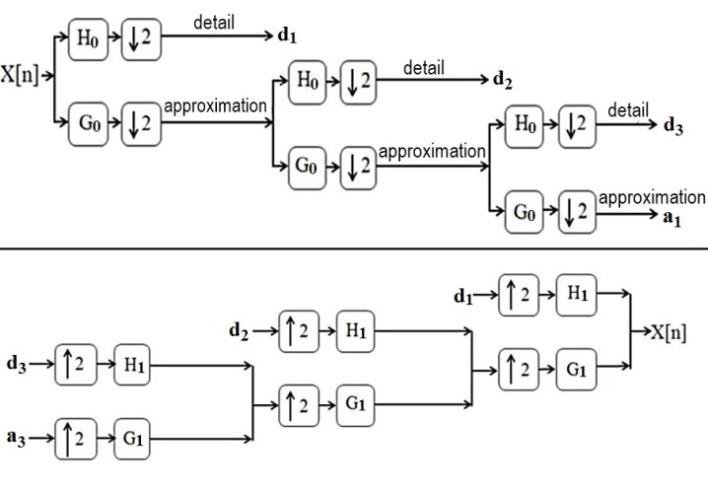
Fig 4: Single Level Reconstruction [6] Fig 5: Multilevel Level Reconstruction [7]
Thresholding
Wavelet thresholding has an important role to play in the case of image denoising using the wavelet transform algorithm. Let’s say, P={pij, i=1,2,4…,M, j=1,2,4,..,N} where M and N are the power of 2. Now some Gaussian noise is added with the image and P’ (P’=P+N, where N is the additive noise). After passing through the DWT function the noisy image will generate the coefficients with four sub-bands(HH, HL, LH, LL) where LL is the approximation coefficient and the others are detailed coefficients. Now, the thresholding methods are applied to each of these coefficients to remove the noise. There are two types of thresholding that can be applied. Those are Hard thresholding and soft thresholding.
a) Soft thresholding
The soft thresholding function takes the argument and if its absolute value is less than the threshold then it gets converted to zero otherwise it is shrunk by the threshold value. The function can be written as:

b) Hard thresholding
Unlike soft thresholding the hard thresholding discontinuous. It keeps the input coefficients if it is larger than the threshold value and if it is less than the threshold value then the coefficient values are shrunk to 0. The function for Hard thresholding will be:

The thresholding removes the noise only from the detailed coefficients in each level and the approximation coefficients are being kept untouched.
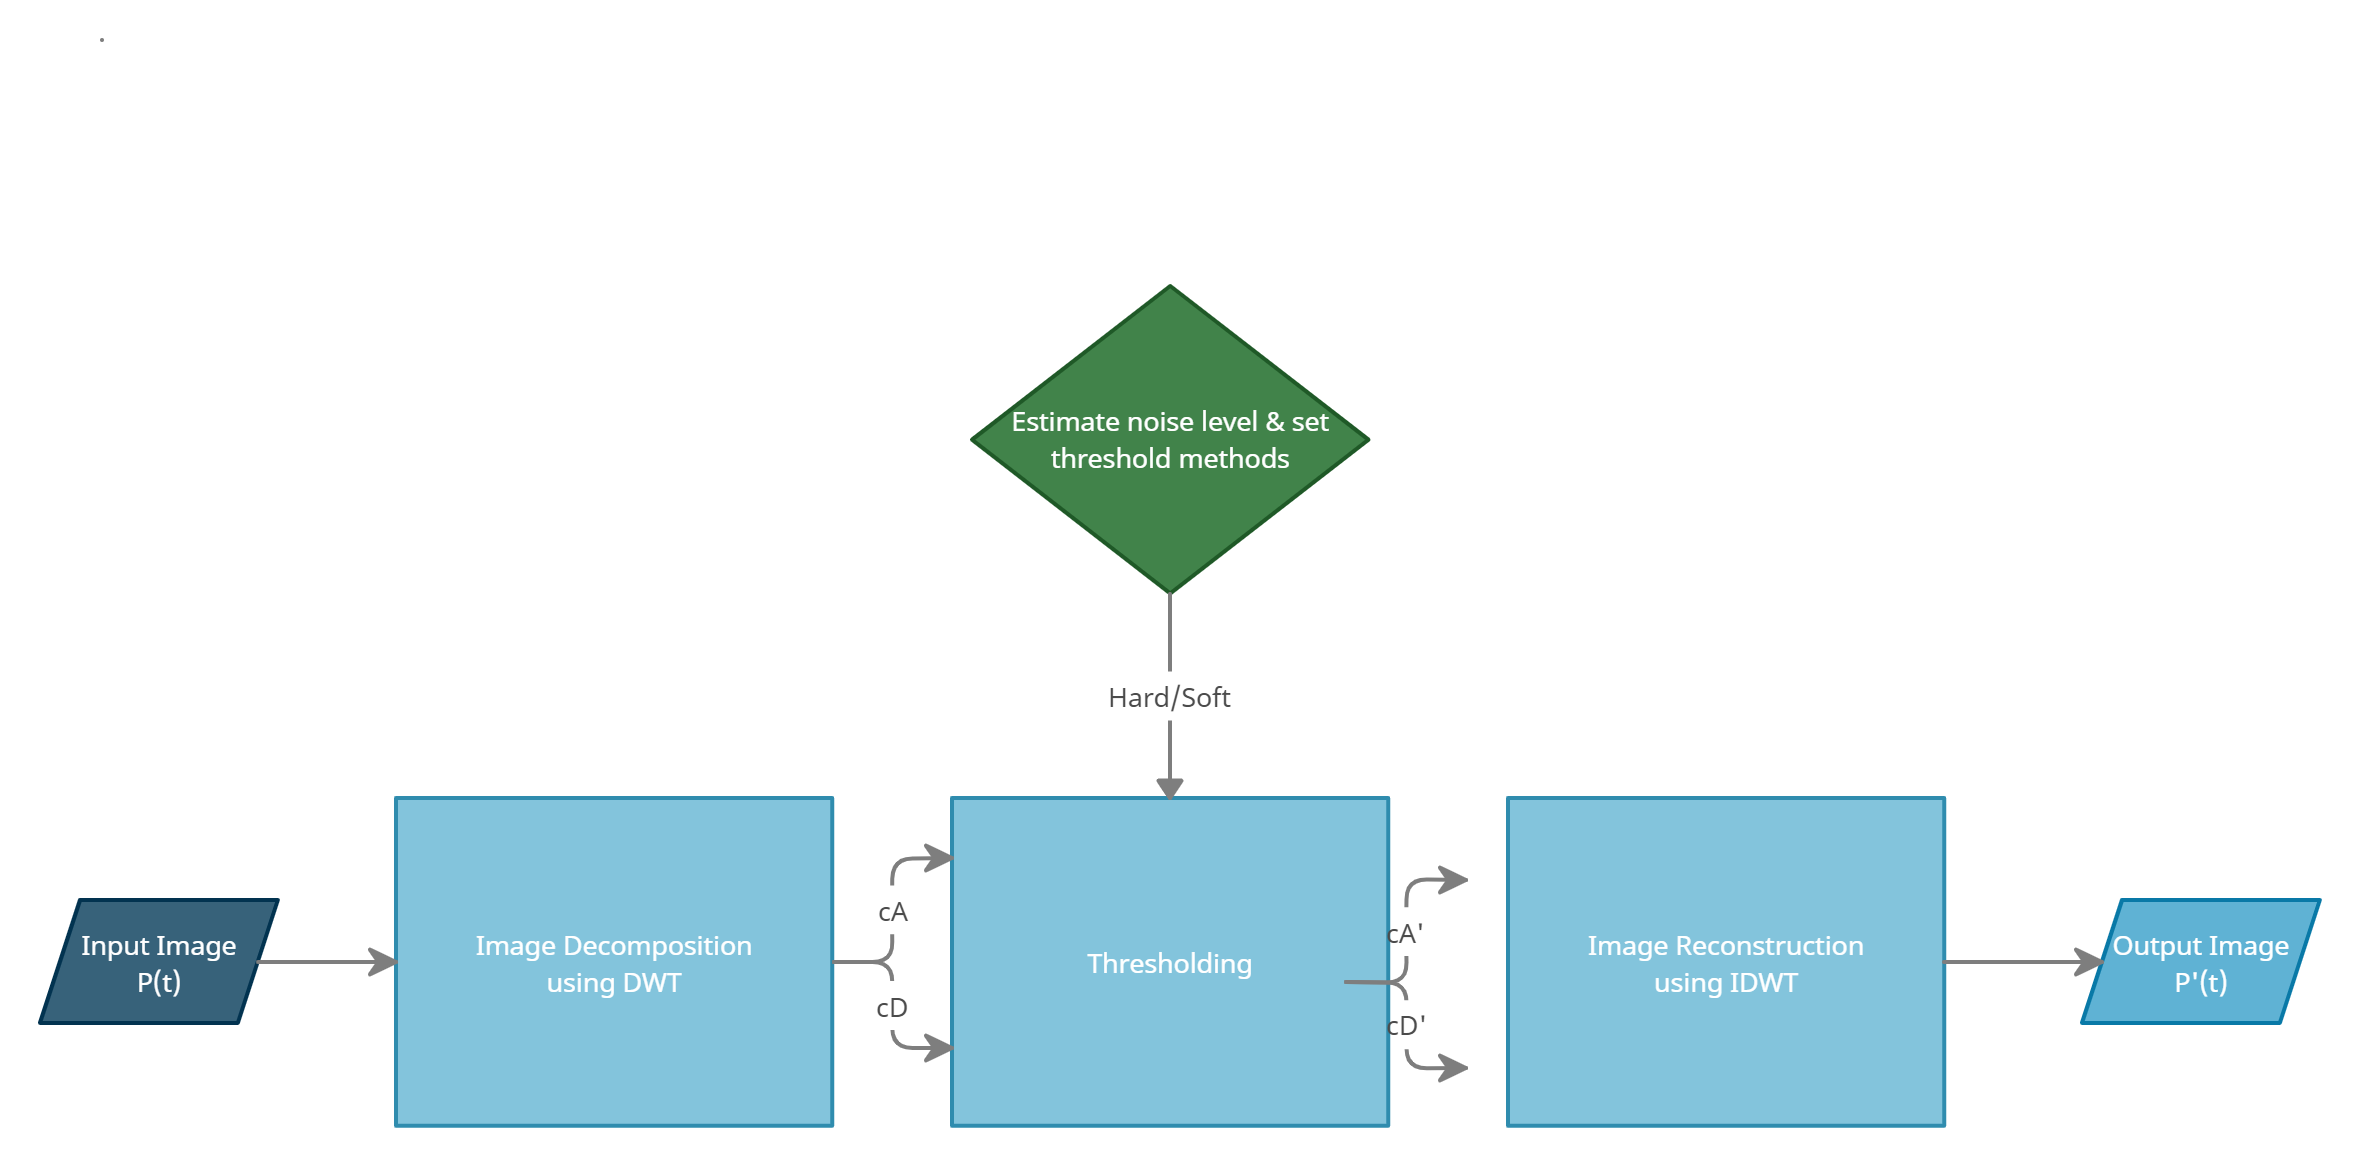
Fig 6: Image denoising using wavelettransform algorithm
This diagram gives basic details of the whole process we discussed till this line.
References:
1. https://georgemdallas.files.wordpress.com/2014/05/wavelets2.jpg?w=640
2. DENOISING OF NATURAL IMAGES USING THE WAVELET TRANSFORM By Manish Kumar Singh
8. An Effective Image Denoising Using Adaptive Thresholding In Wavelet Domain V. Mahesh, M. Someswara Rao, Ch. Sravani M. Tech, P. Durgarao, S. Venkatesh
The media shown in this article are not owned by Analytics Vidhya and is used at the Author’s discretion.


