I’ll begin with an admission -– I intentionally left out a rather critical aspect of memory limit configuration. The omission was that, like several other SSAS settings, once the configured value goes over 100% it changes to an explicit setting. In the case of memory limits the explicit setting is translated as bytes.
Unfortunately, for some reason this is not covered in the SSAS documentation… however, it is covered elsewhere, including this doc: SQL Server 2005 Analysis Services (SSAS) Server Properties.
In this case, the first thing we had the tester check was the actual configured setting values, as well as the values being returned from the associated Windows performance counters as a sanity check.
Here is what they sent back:
Memory Limit Setting –> Configured Value (bytes) –> Perf Counter Value (KB)
Memory\LowMemoryLimit –> 2097152 –> 8192
Memory\TotalMemoryLimit –> 13531488 –> 13312
Hopefully the problem is starting to become clearer. Apparently the configuring user had tried to use an explicit amount of memory, however they had inadvertently entered kilobytes (KB) instead of bytes!
These values translated to approx 8MB and 13MB for the Low and Total limits respectively, which explains what they were seeing on the chart. It was no graphical anomaly. (Note that even though the configured Low value should have been approx 2MB, apparently the minimum SSAS will use is 8MB, which explains the associated perf counter value of 8192 KB.)
Ok, so we figured out what was going on on the chart, but what about the impact these abnormally low settings would have on SSAS performance? As I mentioned before, this client had had many problems with SSAS performance, and as a result had engaged Microsoft to come in and help.
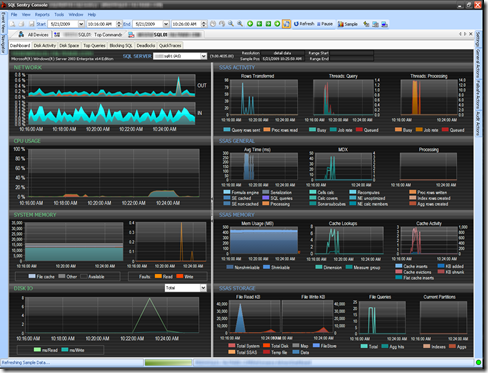
Here’s where things get very interesting. First, take a look at the dashboard shot the client sent to us, which shows the memory issue along with the execution of a single MDX query that ran for a couple of minutes:
Here’s a closeup of the Memory Usage chart:
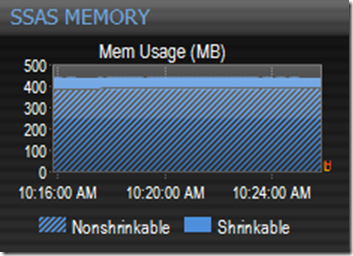
What’s wrong with this picture? Well, a couple of things. First, SSAS memory usage is almost completely flat, and is almost entirely nonshrinkable. Typically SSAS memory will grow and shrink continuously as memory is allocated and deallocated for querying and processing operations, and will stabilize with a much larger base proportion of shrinkable memory than we see here.
To illustrate this better, on a test SSAS instance I configured the limits artificially low and let it run for a while, then increased the limits much higher so that there was no memory pressure:
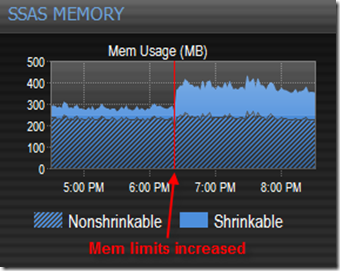
The same system, zoomed into a 10 minute range:
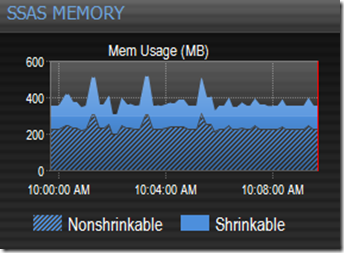
What the flat memory line means is that the unusually low limits are effectively preventing SSAS from loading any data into either of its caches — the Formula Engine (FE) cache (aka, “query engine cache”) or Storage Engine (SE) cache.
This is further confirmed by looking at a few other charts. Notice the Cache Activity chart shows almost continual evictions and memory shrinkage while the query is running:
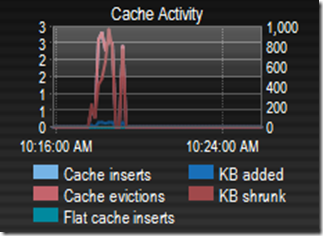
This is not normal! You rarely want to see these values above zero, because when you do it means that memory cleaner threads have kicked in because of internal memory pressure and are moving data out of memory. In this case the data is being moved out as fast as it is moved in.
Also have a look at the Avg Time chart:
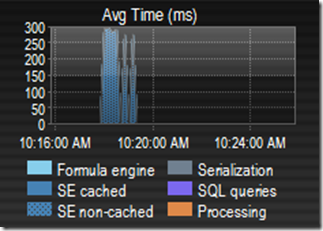
This shows that SSAS is spending almost all of it’s time on non-cached storage engine operations (SE non-cached), which is where you typically want it to spend the least amount of time. This means that every time a query needs data it’s unable to find it in the FE cache, so the formula engine issues requests to the storage engine, which is unable to find the data in its cache, so it has to go to the file system to get it from either measure group partitions or aggregations. Partitions can be orders of magnitude slower than retrieving the data directly from cache, and is almost certainly why the query took so long.
As an aside, originally I’d actually called this the “Wait Time” chart since what we are showing here is similar to what you see with SQL Server wait types, but Carl Rabeler convinced me otherwise since what the chart is actually showing is “time spent” on the different operations, versus time spent waiting. You could probably get into a semantical debate about this since many of the SQL Server wait types pretty much show “time spent” as well… but it’s just not worth any potential confusion from injecting some Database Engine terminology into the Analysis Services lexicon, no matter how tempting it may be. 😉
In any event, this chart is critical because you can see exactly where SSAS is spending most of it’s time over any date range, which can be extremely important for profiling a server and determining where the bottlenecks lie.
Next have a look at the File Queries chart, the Total metric in particular:
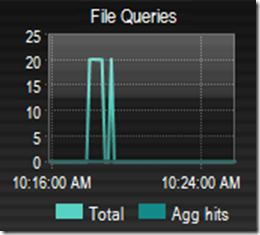
As I mentioned, the formula engine generates requests to the storage engine for measure group data when it’s not in the FE cache. The total queries metric shows how many times the storage engine had to go to the file system to read data from a measure group partition (or aggregation) when the data wasn’t in the SE cache. Here again is another value you typically want to be as close to zero as possible, because when it’s >0 it means that SSAS couldn’t find the data in either the FE cache OR the SE cache.
Note that you will see values >0 when an aggregation is first hit and loaded into the SE cache, since Total covers both Agg hits and partition queries. But since agg hits are much lighter weight than partition queries this is generally not a problem.
It is also perfectly normal to see values >0 when the cache is cold and queries first start coming in. For example, if you process your cubes overnight the associated cache data will be invalidated, and you’ll probably see file queries spike up in the morning when users come in and start issuing MDX queries, then settle down as the data is cached. If you see that total queries are continually above zero throughout the day, memory pressure is a likely culprit.
Impact on MDX Query Performance
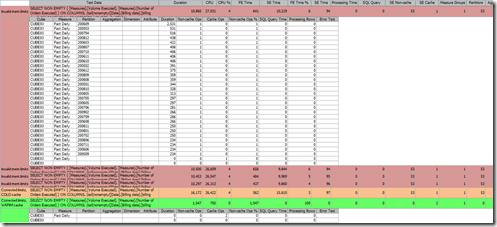
So what happened after the invalid memory limit settings were corrected? Here is some actual query data from the Performance Advisor Top Queries tab which our beta tester was nice enough to export for me:
The queries in red ran with the invalid low memory limits. Notice every single one had to go to the storage engine for the data every time. All had 53 non-cached operations, high cpu cycles, durations of >10 seconds, and all spent 94-97% of that time in the storage engine, for obvious reasons.
Once the limits were changed, the 2nd execution of the query (green) took about 1.5 seconds, with zero non-cached ops, very low cpu, and 100% of the time was spent in the formula engine! This is a fantastic example of how things are supposed to work when there is memory available and limits are configured properly. Most future runs of this query actually dropped under our default trace filter of >=1000ms, and so no longer showed up at all in Top Queries.
Note that the first run of the query after changing the memory limits (orange) actually took longer than the runs with the invalid limits, although everything else was about the same. At first I was puzzled by this, but then it occurred to me that this may be because SSAS was finally able to actually load the data into cache, and the extra 6 seconds may just be overhead related to the associated memory allocations. Or it may have just been an anomaly related to other activity on the server at the time, not sure.
Even though the performance before the change was pretty bad, things actually could have been much worse. There was one very big saving grace for this client that allowed SSAS to run as well as it did with the invalid memory limits. It’s actually very clear on the dashboard what that is, but I’ll save that one for another post 😉
Mini-contest Winner!
Congrats to Norbert Kessler from WebTelligence, a SQL Server consulting firm in Germany and one of our beta testers, for nailing the answer pretty much right on the head. He wins the free license of Performance Advisor for Analysis Services. John Welch was very close, and actually brought up another pretty serious misconfiguration — when the high and low limits are configured with the same value. This is a common practice in the SQL Server world, but a big no-no with SSAS. Another topic for a future post perhaps…


