


This article was published as a part of the Data Science Blogathon
Introduction
This blog mainly tells the story of the Machine Learning life-cycle, starting with a business problem to finding the solution and deploying the model. This helps beginners and mid-level practitioners to connect the dots and build an end-to-end ML model.
Here are the steps involved in an ML model lifecycle.
Step 1: Business context and define a problem
Step 2: Translating to AI problem and approach
Step 3: Milestones and Planning
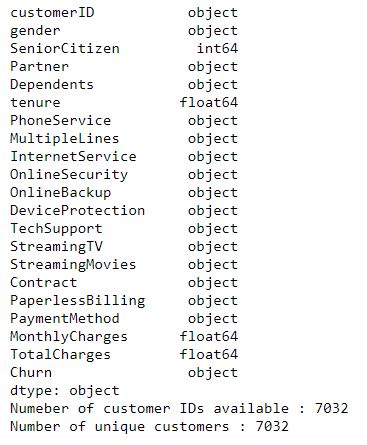
Step 4: Data gathering and Understanding
Step 5: Data preparation
Step 6: Data Cleaning
Step 7: Exploratory data analysis
Step 8: Feature engineering and selection
Step 9: ML Model assumption and checks
Step 10: Data preparation for modelling
Step 11: Model Building
Step 12: Model Validation & Evaluation
Step 13: Predictions & Model deployment
All the above-mentioned steps are explained in simple words below. Telecom customer Churn’s use case is taken as an example throughout the blog to keep things simple.
Step 1: Business context and define a problem

Challenges involved:
The main challenge involved here is understanding the business context and also figuring out what are the exact challenges business is facing.
Example:
Basic understanding of what is telecom industry and how it works. In the Churn use case, the problem statement is to identify the drivers for un-subscription and also to predict existing customers who are at high risk of un-subscribing in near future. So that a retention strategy can be planned.
Step 2: Translating to AI problem and approach
Challenges involved:
Translating a business problem to an AI problem is the main challenge industry is facing. Many of the models built are not production-ready, due to a mismatch of expectations from the business view. This happens if the business context/problem is unclear or the business problem is not properly translated to an AI problem.
Example:
Churn model can be taken as a Machine learning-based Classification problem. Users of similar behavioural patterns need to be grouped, which helps in planning a retention strategy.
Step 3: Milestones and Planning
Challenges involved:
Computational & human resource allocation planning and also estimating a proper deadline for each milestone.
Example:
If the data is too large to handle, the computational time for local machines will be more. This kind of cases need to be planned and deadlines need to be planned
Step 4: Data gathering and understanding
Challenges involved:
Some of the potential features which affect the target may not be captured by the business in the past. A very good understanding of the provided features is needed.
Example:
“Cus_Intenet” is one of the features provided, which is not clear by just seeing the feature name. This needs to be clarified from the business, what it means.
Step 5: Data preparation
Challenges involved:
Data can be from different database management systems like SQL, Oracle DBMS. Prior knowledge is needed on clubbing the data from different data sources.
Example:
Data for internet users and non-internet users can be in different databases. Data of a user’s internet balance and main balance can be in different files, which need to be clubbed based on UserID.
Step 6: Data Cleaning
1. Duplicates
Example: Same customer data might be repeated in the entries, which can be identified using customer ID.
2. Data validity check
Example: Customer bill containing negative values.
3. Missing values
Example: If the data is normally distributed, mean imputation can be performed. If the mean and median difference is huge, median imputation is preferred.
4. Outliers
Example: The age of a customer cannot be 500. It is a data entry mistake.
Step 7: Exploratory data analysis
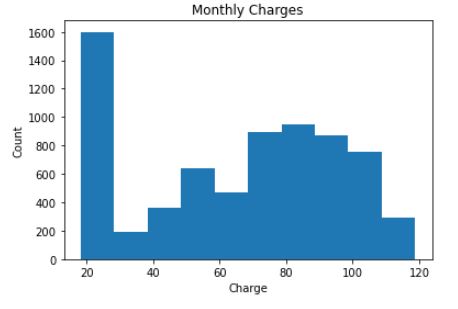
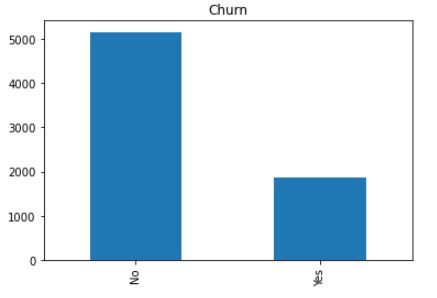
1. Uni-variate analysis
Example: Monthly charges distribution, Numbers of churners and non-churners
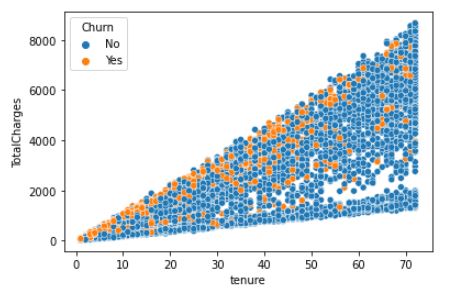
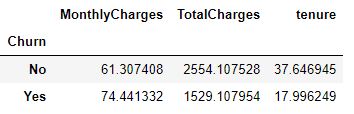
2. Bi-variate/Multi-varaite analysis
Example: Identifying the churn based on user tenure and total charges.
3. Pivots
Pivots allow us to draw insights from the data in a quick time.
4. Visualization and Data insights
Based on the data visualization in step 2 and 3, insights into the data need to observe and noted. These insights of data are the takeaway points from step 4.
Example: Identifying the gender and age group of churners.
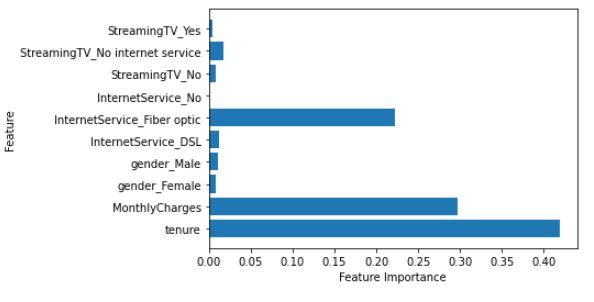
Step 8: Feature engineering and selection
Challenges involved:
Need to identify the right drivers/features which affect the target variable. This requires a solid understanding of business context and use case.
Example:
If the data doesn’t contain “customer tenure” which is important, it needs to be derived based on the subscription start date and current date.
Step 9: ML model assumption checks
Challenges involved:
In most cases, model assumptions don’t hold good for real-world data.
Example:
The linear regression model assumes
4. No multicollinearity in the data
Step 10: Data Preparation for Modelling
1. Create Dummy variables
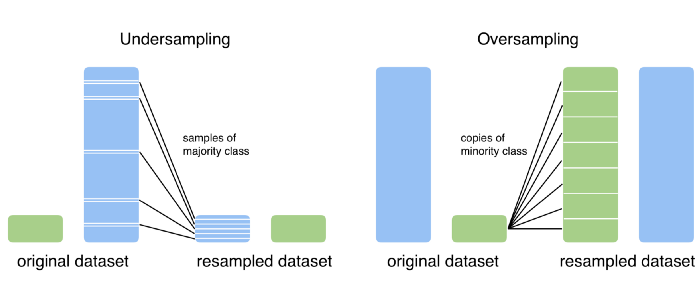
2. Over Sampling and Under Sampling
Oversampling and Undersampling are the techniques used when the data is imbalanced.
3. Split the data into train and test
Step 11: Model Building
Example:
Customer classification can be done by using Decision trees, Random Forest classifier, Naive Bayes models, and much more.
Step 12 : Model Validation & Evaluation
1. Testing the model :
2. Tuning the model :
3. Cross-validation :
4. Model Evaluation metrics trade-off :
5. Model Underfitting and Overfitting :
- Underfitting is the case, where the model is not learning properly in the training data and also not performing well in test data.

Challenges involved :
-
-
- Model overfitting and underfitting.
- Choosing the right model evaluation metric based on business context.
-
Step 13: Prediction & Model deployment
Model deployment is out of scope for this article to discuss. For more information on Model deployment please check “Deploying Machine Learning Models“.
The media shown in this article are not owned by Analytics Vidhya and is used at the Author’s discretion.