


Introduction
Today’s post is going to be very different from all the post I have published till now. For past few months, I have been working on projects which are very close to the end customers. This type of role is uniquely different because I had to take off my analytics hat and place “a customer’s perspective hat.”
I got shot down a lot with the tools I had in my toolkit. So I thought of upskilling myself with new set of tools. I have been researching a lot on customer behavior and psychology & I was amazed with what all I did not know!
Do not expect a lot of machine learning, ensemble modeling, etc. in this article. Against my reputation on AV, I want to take a stab to explain something most of the people in our industry are completely unaware of. This article is a crash course on behavioral economics and how it integrates so well with analytical space.
Let’s start with a simple quiz to show the impact of what I will discuss.
A small Quiz
Let’s start with a few simple questions before I explain the key points. There is only one rule in this exercise – You need to forget the previous questions completely (when asked) and come back as new person when you move to the next question. The order of the questions is very important and the exercise will be of no use if you do not follow the rules.
On your Marks, Get Set, Go…
Loading…
I know these were some tough questions, but hopefully I still have your attention now.
Let’s analyze your choices now
Lately, Behavioral economics have caught a lot of my attention. While I read more and more about it, I see a strong opportunity of integrating this study with analytics. In a few articles, I will try to make my point clear. We will try to make predictions in case of above questions using behavioral economics. Then we will see how analytical answer is different from that derived from behavioral economics.
Here is my prediction without knowing what you selected:
Question 1 – Medium Size
Here is the distribution of the response based on survey on readers like you:
Question 2 – $10 – Here is what the readers have chosen:
Question 3 – Option 3 (Even though you might have chosen 1 but you might have found it hard to decide this time between 1 and 3)
Question 4 – This one is just to set up the grounds for Question 5.
Question 5 – Say person A selected 99 and person B selected 11 as the random number. On an average person A will be willing to pay more than person B. Check out the scatter plot from the responses below:
Question 6 – Option A – Pay $100 now
Question 7 – Option B – Pay $1010
Question 8 – Red
Question 9 – White (If you did the probability calculations right)
Question 10 – Option A – Take $100
Question 11 – Option B – 30 slots
How many correct answers did you get? Please let me know through the comments below
What tools did I use to make these predictions?
If my model was a random chance, the expected number of questions I can get right is less than 50% (as a few questions have more than 1 choice). If I got more than 50% right, I don’t need to convince you to read further.
However, if by chance I got lesser, you should know that you are only one of the cases where these theories failed. Analytics and behavioral economics run on very similar foundation i.e. lots and lots of experiments.
The two are only different on the following aspect.
“We define a target population before we test a hypothesis. However, most of the fundamentals in behavioral science apply on any type of population.”
Even with this difference, I believe these additional tools in your tool kit will take you a long way. I will cover how to use these new tools in following article.
In this article, I will introduce you to the concepts applied for the predictions to the 10 questions.
Question 1 underlying principle – The compromise effect
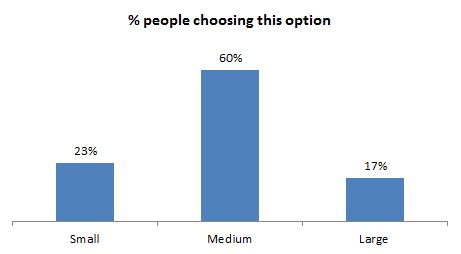
This is the easiest one. Human has a tendency to find the middle option. I never told you the price of the 3 options or the size of the 3 options. All the information you had was that the sizes are Large > Medium > Small. Here is an interesting study done by a professor of Duke University you might like – A cafe served three options as Small – 30 units @ $3, Medium – 50 units @ $4, Large – 80 units @ $5.
Here is what you get as the distribution of people buying each size.
The cafe changed the sizes after 3 months. Now they had – Small – 50 units @ $4, Medium – 80 units @ $5, Large – 100 units @ $6. You are right, they just changed the names from Medium size to Small, Large to Medium and introduced a new Large.
What do you expect now?
Here is what the distribution looks like:
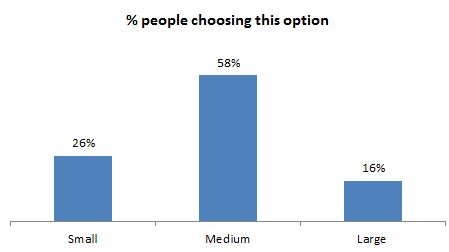
WOW, right!! The distribution did not change a lot but cafe started earning higher cost per coffee sold. Easy money!!
Question 2 & 3 underlying principle – The decoy effect
Human mind is trained to make choices between similar objects. We get confused when we compare Apples to Oranges. Consider the following situation – You need to make choice among A, B and C. You are evaluating it on two possible features – Feature 1 and Feature 2. Higher the value on each feature, better is the choice.
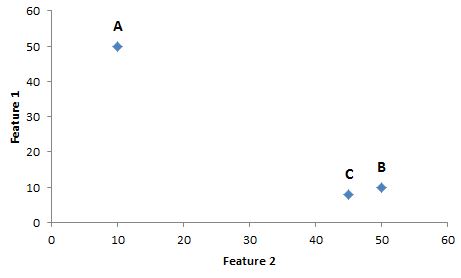
So what do you choose ?
We know A and B have trade off. B is definitely better than C, but again we have a trade off between A and C.This is because B is better than C. Humans have a tendency to see it as the best choice rather than just a better choice. So we choose B. C is here a decoy effect.
So what happens in Question 2 and 3 ?
In Question 2 you make a trader off choice between the ease of reading and the cost. You might have chosen either of the two based on your personal preference.
However, Question 3 is something especial. Here you have a decoy option which is just a hard copy. You see that Option 3 is like you pay for the hard copy and get the soft copy free. Even though no one will choose the Option 2 in this question, but it is a decoy!!
It already did what it was supposed to do. It makes people think Option 3 is not that bad!!!
Option 3 in question 3 and Option 2 in question 2 is the same, but the probability of someone choosing Option 3 in question 3 is higher, even though the overall probability of two option together is almost 1 in both the questions (as Option 2 in question 3 is a zero probability event).
Do you recognize what a tool you now have to play with. If not, I will talk so much more about this lever in my following articles.
Decoy effect is often used by marketing engineers all the time.
Question 4 & 5 underlying principle – The anchoring effect
Anchoring effect is my favorite. Why do you think we are ready to pay more than $600 for an I-Phone 7 and just $200 for an alternate phone with the same features?
The answer lies in anchoring effect. The price of any item is based on perception rather than the actual cost of the raw materials used. As there is no logical way to get the right price I wish to pay for an item X, I will use an anchor to find the right price.
Question 4 sets an anchor and Question 5 uses that anchor. Even though the anchor here was a random number you chose, I was able to make you believe that the actual cost of something abstract like a “special” course (which you have no other way to put a value tag) is close to this anchor.
If you chose a very high random number, even if you decrease the value enough, you can’t go that low. So if you had a high number assumed, you will still value this course high enough compared to the one who chose a small random number. The concept is difficult to digest, but it is being leveraged all around you. Think of a charity auction. We start with a price and start bidding higher. The starting price is an anchor and the final price at which the item is sold is highly correlated to this anchor.
Question 6 & 7 underlying principle – The steep temporal discounting effect
Another interesting concept in understanding human psychology is the temporal discounting. We all know that the value of money goes down with time because of inflation. If you are in a developing country, you probably see an inflation of 6-10% and in a developed country, you are looking at 0 – 3%. We are talking about something very different here. Both the questions, show a value gain of 1% in a week, so the inflation adjustment has no role here. So what makes us choose option 1 in 6 and option 2 in 7?
We have a tendency to value money in near future with a strong discounting factor but such discounting factor becomes small when we talk about longer time frames.
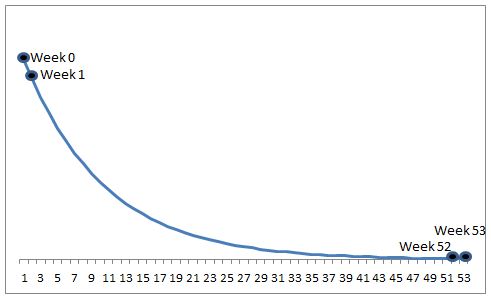
We see Week 0 and Week 1 as dramatically different. However, Week 52 and 53 look similar. This has been proven in many experiments done in behavioral science.
Question 8 & 9 underlying principle – The “unknown unknowns” effect
Let’s think of Question 8 first. What is the estimated value of winning with choosing “Red” color?
Estimated Probability of getting a Red ball : 30/90
Estimated value : (1/3 * $30) – $10 = $0
What is the estimated value of winning with choosing the “Blue” or “White” ball?
Estimated number of Blue or White balls = 30 (as both are equally likely)
Estimated Probability of getting a Blue ball = 30/90
Estimated Value = (1/3 * $30) – $10 = $0
Basically, estimated value of each bet $0. So, why do you choose the Red Ball? This again comes to human psychology. There are two separate concepts we talk about in behavioral economics – Risk and Ambiguity.
Risk is when you know the probability of event. This is what we call “Known Unknown”.
Ambiguity is when you are not sure about the probability or the chances of favorable events. This is what we call “Unknown Unknown”.
Human has a tendency to underestimate probabilities when they face ambiguity. Choosing Red ball here is a risk and choosing White or Blue ball is ambiguity.
If you are not yet convinced, let’s look at Question 9.
Why did you reverse your choice?
This time Blue + White balls is a known number 60 and Red + Blue is unknown. So you switch the choice from Ambiguity to Risk.
Question 10 & 11 underlying principle – The extreme probability bias effect
In both the question 10 & 11 the trade off is the same – you pick option with lower probability to win, you get higher expected value. So what makes you flip the decision between the two questions. Human brain is wired to perceive probability not at the face value but by multiplying it with a predictable function. Following graph will make it more clear.
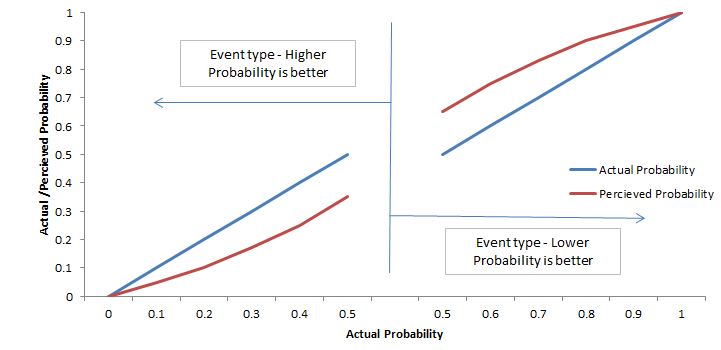
We are aligned with the actual probability at 0 and 1. But we tend to underestimate probability between 0 and 0.5 if event is favorable and exactly opposite happens when event is unfavorable.
This is because we want to be risk averse most of the times. With underestimated perceived probability, we underestimate the value of Risky transactions. This is why a no – risk (Probability to win of 1) looks to have much higher estimated value.
Question 11 is however a decision between probability that are close to each other. Here we take a decision based on the actual estimated value.
We now become smart! when no option has extreme probabilities.
End Notes
In this article, I have introduced you to a new tool kit. Using this tool kit is still a skill set we need to acquire. I consider myself as a student in this field but I can definitely try to bring out precise application of these tools.
The examples quoted in this article are variants of the successful behavioral experiments done by Duke University professors – Dan Ariely and Scott Huettel. I have no way done a justice with the depth of studies they have done in this field but this is just spread more awareness of their work. If you liked reading this article, I will encourage you to read their books – “Predictably Irrational” and “Behavioral Economics – When Psychology and Economics Collide”. I have definitely been enriched by these concepts and have developed a much better lens to see the world around us.
Before I do that, I will want to know your opinion on this new stream of article – Did you learn something new? Did you find it interesting? Will you want to learn more? Do you see any application of these concepts in your world?
Learn, compete, hack and get hired!
Tavish Srivastava, co-founder and Chief Strategy Officer of Analytics Vidhya, is an IIT Madras graduate and a passionate data-science professional with 8+ years of diverse experience in markets including the US, India and Singapore, domains including Digital Acquisitions, Customer Servicing and Customer Management, and industry including Retail Banking, Credit Cards and Insurance. He is fascinated by the idea of artificial intelligence inspired by human intelligence and enjoys every discussion, theory or even movie related to this idea.