Introduction
Classification problems are quite common in the machine learning world. As we know in the classification problem we try to predict the class label by studying the input data or predictor where the target or output variable is a categorical variable in nature.
If you have already dealt with classification problems, you must have faced instances where one of the target class labels’ numbers of observation is significantly lower than other class labels. This type of dataset is called an imbalanced class dataset which is very common in practical classification scenarios. Any usual approach to solving this kind of machine learning problem often yields inappropriate results.
In this article, I’ll discuss the imbalanced dataset, the problem regarding its prediction, and how to deal with such data more efficiently than the traditional approach.
This article was published as a part of the Data Science Blogathon.
Table of contents
What is Imbalanced Data and How to Handle it?
Imbalanced data refers to those types of datasets where the target class has an uneven distribution of observations, i.e one class label has a very high number of observations and the other has a very low number of observations.
We can better understand imbalanced dataset handling with an example.
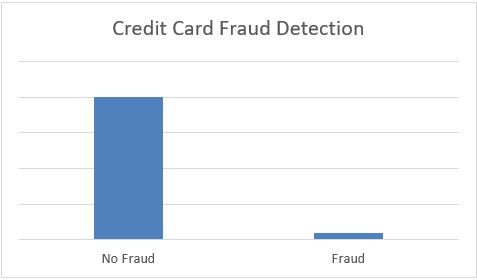
Let’s assume that XYZ is a bank that issues a credit card to its customers. Now the bank is concerned that some fraudulent transactions are going on and when the bank checks their data they found that for each 2000 transaction there are only 30 Nos of fraud recorded. So, the number of fraud per 100 transactions is less than 2%, or we can say more than 98% transaction is “No Fraud” in nature. Here, the class “No Fraud” is called the majority class, and the much smaller in size “Fraud” class is called the minority class.
More such example of imbalanced data is:
- Disease diagnosis
- Customer churn prediction
- Fraud detection
- Natural disaster
Class imbalanced is generally normal in classification problems. But, in some cases, this imbalance is quite acute where the majority class’s presence is much higher than the minority class.
Problems with Handling Imbalanced Data Classification
If we explain it in a very simple manner, the main problem with imbalanced dataset prediction is how accurately are we actually predicting both majority and minority class? Let’s explain it with an example of disease diagnosis. Let’s assume we are going to predict disease from an existing dataset where for every 100 records only 5 patients are diagnosed with the disease. So, the majority class is 95% with no disease and the minority class is only 5% with the disease. Now, assume our model predicts that all 100 out of 100 patients have no disease.
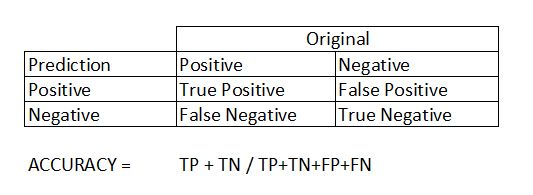
Sometimes when the records of a certain class are much more than the other class, our classifier may get biased towards the prediction. In this case, the confusion matrix for the classification problem shows how well our model classifies the target classes and we arrive at the accuracy of the model from the confusion matrix. It is calculated based on the total no of correct predictions by the model divided by the total no of predictions. In the above case it is (0+95)/(0+95+0+5)=0.95 or 95%. It means that the model fails to identify the minority class yet the accuracy score of the model will be 95%.
Thus our traditional approach of classification and model accuracy calculation is not useful in the case of the imbalanced dataset.
Approach to Handle Imbalanced Data Set Problem
In rare cases like fraud detection or disease prediction, it is vital to identify the minority classes correctly. So model should not be biased to detect only the majority class but should give equal weight or importance towards the minority class too. Here I discuss some of the few techniques which can deal with this problem. There is no right method or wrong method in this, different techniques work well with different problems.
1. Choose Proper Evaluation Metric
The accuracy of a classifier is the total number of correct predictions by the classifier divided by the total number of predictions. This may be good enough for a well-balanced class but not ideal for the imbalanced class problem. The other metrics such as precision is the measure of how accurate the classifier’s prediction of a specific class and recall is the measure of the classifier’s ability to identify a class.
For an imbalanced class dataset F1 score is a more appropriate metric. It is the harmonic mean of precision and recall and the expression is –
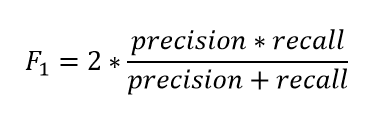
So, if the classifier predicts the minority class but the prediction is erroneous and false-positive increases, the precision metric will be low and so as F1 score. Also, if the classifier identifies the minority class poorly, i.e. more of this class wrongfully predicted as the majority class then false negatives will increase, so recall and F1 score will low. F1 score only increases if both the number and quality of prediction improves.
F1 score keeps the balance between precision and recall and improves the score only if the classifier identifies more of a certain class correctly.
2. Resampling (Oversampling and Undersampling)
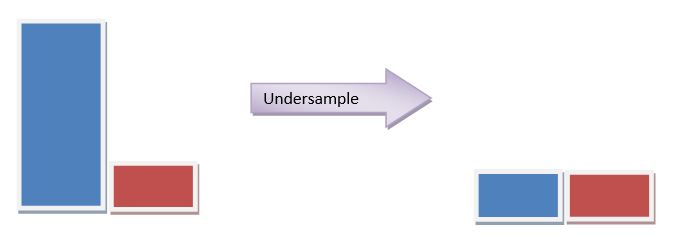
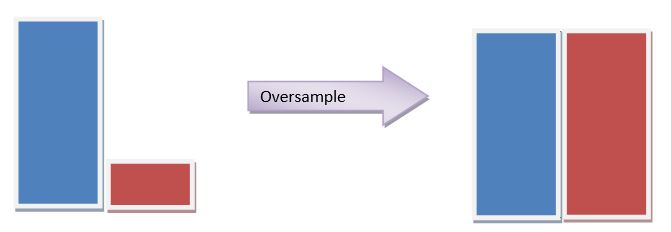
This technique is used to upsample or downsample the minority or majority class. When we are using an imbalanced dataset, we can oversample the minority class using replacement. This technique is called oversampling. Similarly, we can randomly delete rows from the majority class to match them with the minority class which is called undersampling. After sampling the data we can get a balanced dataset for both majority and minority classes. So, when both classes have a similar number of records present in the dataset, we can assume that the classifier will give equal importance to both classes.
An example of this technique using the sklearn library’s resample() is shown below for illustration purposes. Here, Is_Lead is our target variable. Let’s see the distribution of the classes in the target.
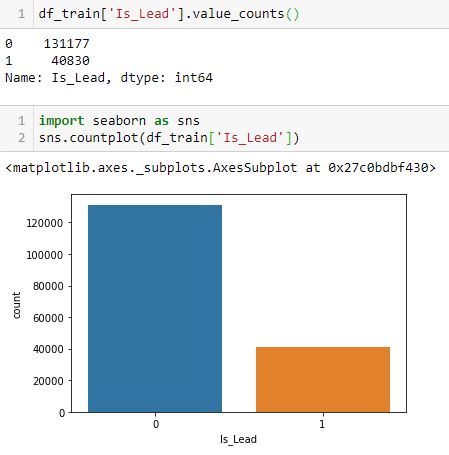
It has been observed that our target class has an imbalance. So, we’ll try to upsample the data so that the minority class matches with the majority class.
from sklearn.utils import resample
#create two different dataframe of majority and minority class
df_majority = df_train[(df_train['Is_Lead']==0)]
df_minority = df_train[(df_train['Is_Lead']==1)]
# upsample minority class
df_minority_upsampled = resample(df_minority,
                                 replace=True,    # sample with replacement
                                 n_samples= 131177, # to match majority class
                                 random_state=42)  # reproducible results
# Combine majority class with upsampled minority class
df_upsampled = pd.concat([df_minority_upsampled, df_majority])
After upsampling, the distribution of class is balanced as below –
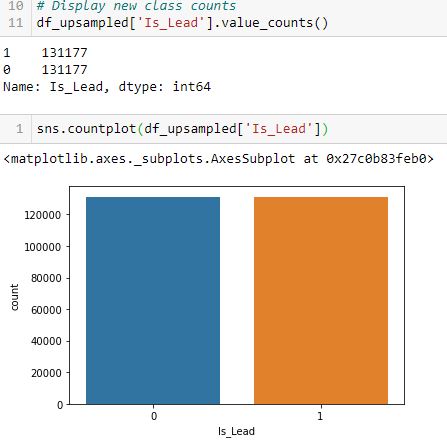
Sklearn.utils resample can be used for both undersamplings the majority class and oversample minority class instances.
3. SMOTE
Synthetic Minority Oversampling Technique or SMOTE is another technique to oversample the minority class. Simply adding duplicate records of minority class often don’t add any new information to the model. In SMOTE new instances are synthesized from the existing data. If we explain it in simple words, SMOTE looks into minority class instances and use k nearest neighbor to select a random nearest neighbor, and a synthetic instance is created randomly in feature space.
I am going to show the code sample of the same below:
from imblearn.over_sampling import SMOTE
# Resampling the minority class. The strategy can be changed as required.
sm = SMOTE(sampling_strategy='minority', random_state=42)
# Fit the model to generate the data.
oversampled_X, oversampled_Y = sm.fit_sample(df_train.drop('Is_Lead', axis=1), df_train['Is_Lead'])
oversampled = pd.concat([pd.DataFrame(oversampled_Y), pd.DataFrame(oversampled_X)], axis=1)
Now the class has been balanced as below

4. BalancedBaggingClassifier
When we try to use a usual classifier to classify an imbalanced dataset, the model favors the majority class due to its larger volume presence. A BalancedBaggingClassifier is the same as a sklearn classifier but with additional balancing. It includes an additional step to balance the training set at the time of fit for a given sampler. This classifier takes two special parameters “sampling_strategy” and “replacement”. The sampling_strategy decides the type of resampling required (e.g. ‘majority’ – resample only the majority class, ‘all’ – resample all classes, etc) and replacement decides whether it is going to be a sample with replacement or not.
An illustrative example is given below:
from imblearn.ensemble import BalancedBaggingClassifier
from sklearn.tree import DecisionTreeClassifier
#Create an instance
classifier = BalancedBaggingClassifier(base_estimator=DecisionTreeClassifier(),
                                sampling_strategy='not majority',
                                replacement=False,
                                random_state=42)
classifier.fit(X_train, y_train)
preds = classifier.predict(X_test)
5. Threshold Moving
In the case of our classifiers, many times classifiers actually predict the probability of class membership. We assign those prediction’s probabilities to a certain class based on a threshold which is usually 0.5, i.e. if the probabilities < 0.5 it belongs to a certain class, and if not it belongs to the other class.
For imbalanced class problems, this default threshold may not work properly. We need to change the threshold to the optimum value so that it can efficiently separate two classes. Also, we can use ROC Curves and Precision-Recall Curves to find the optimal threshold for the classifier. We can also use a grid search method or search within a set of values to identify the optimal value.
Searching Optimal Value From a Grid
In this method first, we will find the probabilities for the class label, then we’ll find the optimum threshold to map the probabilities to its proper class label. The probability of prediction can be obtained from a classifier by using predict_proba() method from sklearn.
rom sklearn.ensemble import RandomForestClassifier
rf_model = RandomForestClassifier()
rf_model.fit(X_train,y_train)
rf_model.predict_proba(X_test) #probability of the class label
Output:

array([[0.97, 0.03],
       [0.94, 0.06],
       [0.78, 0.22],
       ...,
       [0.95, 0.05],
       [0.11, 0.89],
       [0.72, 0.28]])
After getting the probability we can check for the optimum value.

step_factor = 0.05
threshold_value = 0.2
roc_score=0
predicted_proba = rf_model.predict_proba(X_test) #probability of prediction
while threshold_value <=0.8: #continue to check best threshold upto probability 0.8
    temp_thresh = threshold_value
    predicted = (predicted_proba [:,1] >= temp_thresh).astype('int') #change the class boundary for prediction
    print('Threshold',temp_thresh,'--',roc_auc_score(y_test, predicted))
    if roc_score<roc_auc_score(y_test, predicted): #store the threshold for best classification
        roc_score = roc_auc_score(y_test, predicted)
        thrsh_score = threshold_value
    threshold_value = threshold_value + step_factor
print('---Optimum Threshold ---',thrsh_score,'--ROC--',roc_score)
Output:
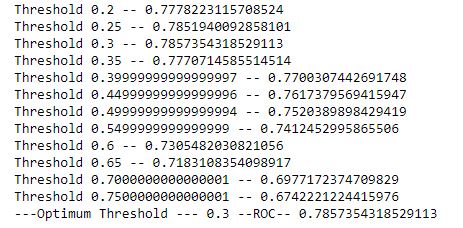
Here, we get the optimal threshold in 0.3 instead of our default 0.5.
Conclusion
In conclusion, effectively addressing imbalanced data is crucial for accurate classification in analytics. These five techniques discussed can greatly improve model performance. For those looking to enhance their analytics skills and dive deeper into data science, consider enrolling in Analytics Vihdya’s BB+ program, a comprehensive learning platform for aspiring data scientists.
Frequently Asked Questions
A. Three ways to handle an imbalanced data set are:
a) Resampling: Over-sampling the minority class, under-sampling the majority class, or generating synthetic samples.
b) Using different evaluation metrics: F1-score, AUC-ROC, or precision-recall.
c) Algorithm selection: Choose algorithms designed for imbalance, like SMOTE or ensemble methods.
A. Several algorithms are capable of handling imbalanced data effectively. Random Forest, for instance, can manage class imbalance through bagging and feature selection. SVM can be adjusted by assigning class weights to penalize errors in the minority class. SMOTE generates synthetic samples for the minority class, aiding in balancing the dataset and improving model performance.
A. When a dataset is imbalanced, several issues may arise. Models may exhibit bias toward the majority class, resulting in poor predictions for the minority class. Accuracy as an evaluation metric can be misleading, as it may appear high while the model’s performance on the minority class is lacking. In real-world applications, dealing with imbalanced data can pose significant challenges, potentially affecting decision-making, particularly in critical domains where accurate predictions are essential.
The media shown in this article are not owned by Analytics Vidhya and are used at the Author’s discretion.


