This article was published as a part of the Data Science Blogathon.
Introduction
Every ML Engineer and Data Scientist must understand the significance of “Hyperparameter Tuning (HPs-T)” while selecting your right machine/deep learning model and improving the performance of the model(s).
Make it simple, for every single machine learning model selection is a major exercise and it is purely dependent on selecting the equivalent set of hyperparameters, and all these are indispensable to train a model. It is always referring to the parameters of the selected model and be remember it cannot be learnt from the data, and it needs to be provided before the model gets into the training stage, ultimately the performance of the machine learning model improves with a more acceptable choice of hyperparameter tuning and selection techniques. The main intention of this article is to make you all aware of hyperparameter tuning.
Hyperparameter tuning is basically referred to as tweaking the parameters of the model, which is basically a prolonged process.
Before going into detail, let’s ask some valuable self-questions on hyperparameter tuning, I am sure this would help you a lot on this magic word. Personally, I experienced that and explain it here.
What are Hyperparameters? How to Differ from a Model Parameter?
As we know that there are parameters that are internally learned from the given dataset and derived from the dataset, they are represented in making predictions, classification and etc., These are so-called Model Parameters, and they are varying with respect to the nature of the data we couldn’t control this since it depends on the data. Like ‘m‘ and ‘C‘ in linear equation, which is the value of coefficients learned from the given dataset.
Some set of parameters that are used to control the behaviour of the model/algorithm and adjustable in order to obtain an improvised model with optimal performance is so-called Hyperparameters.
The best model algorithm(s) will sparkle if your best choice of Hyper-parameters
ML Life Cycle
If you ask me what is Hyperparameters in simple words, the one-word answer is Configuration.
Without thinking too much, I can say quick Hyperparameter is “Train-Test Split Ratio (80-20)” in our simple linear regression model.
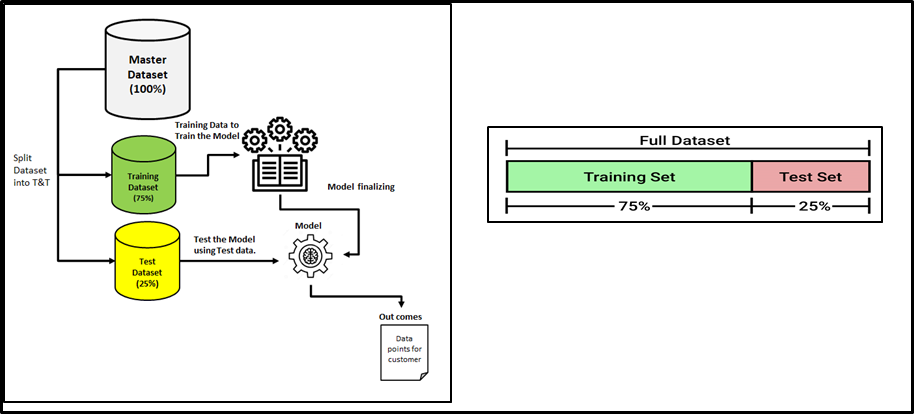
Image designed by the author – Shanthababu
YES! now I can see that, you’re really starting to feel what could be HPs and how it would optimize the model. That’s why I have mentioned earlier in easy language this is configuring values.
Let me give one more example – You can compare this with selecting setting the font and its size for better readability and clarity while you document your content to be perfect and precise.
Coming back to machine learning and recalling Ridge Regression (L2 Regularization) and Lasso Regression (L1 Regularization), In regularized terms we use to have lambda (λ) I mean the Penalty Factor helps us to get a smooth surface instead of an irregular graph.
This term is used to push the coefficients(β) values near zero in terms of magnitude, For more details please refer to my earlier articles https://www.geeksforgeeks.org/blog/2021/11/study-of-regularization-techniques-of-linear-model-and-its-roles/. This is nothing but hypermeters.

Image designed by the author – Shanthababu
For better clarity and understanding, here is one more classical representation for you.

From the above equation, you can understand a better view of what MODEL and HYPER PARAMETERS is.
Hyperparameters are supplied as arguments to the model algorithm during initializing them as key, value and their values are picked by the data scientist, who is building the model in iterative mode.
Hyperparameter Space
As we know that there is a list of HPs for any selected algorithm(s) and our job is to figure out the best combination of HPs and to get the optimal results by tweaking them strategically, this process will be providing us with the platform for Hyperparameter Space and this combination leads to provide the best optimal results, no doubt in that but finding this combo is not so easy, we have to search throughout the space. Here every combination of selected HP value is said to be the “MODEL” and have to evaluate the same on the spot. For this reason, there are two generic approaches to search effectively in the HP space are GridSearch CV and RandomSearch CV. Here CV denotes Cross-Validation.
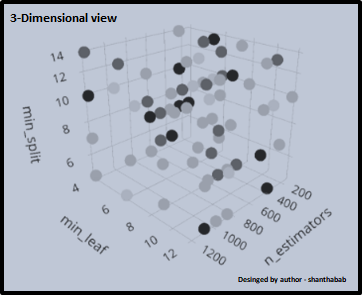
Image designed by the author – Shanthababu
Before going to apply the above-mentioned search options on the data/model, we must split the data into 3 different sets. I can understand your mind voice, already we are splitting the dataset as Train and Test, now one more track? Yes, there is a valid reason are there, that is nothing but to prevent the “DATA LEAKAGE” during Training, Validating and Testing. remember we shouldn’t touch the test data set until we move the model into production deployment.
Data Leakage
Well! Now quickly will understand what is Data leakage in ML, this is mainly due to not following some of the recommended best practices during the Data Science/Machine Learning life cycle. The resulting
is Data Leakage, that’s fine, what is the issue here, after successful testing with perfect accuracy followed by training the model then the model has been planned to move into production. At this moment ALL Is Well.
Still, the actual/real-time data is applied to this model in the production environment, you will get poor scores. By this time, you may think that why did this happen and how to fix this. This is all because of the data that we split data into training and testing subsets. During the training the model has the knowledge of data, which the model is trying to predict, this results in inaccurate and bad prediction outcomes after the model is deployed into production.
Causes of Data Leakage
- Data Pre-processing
- The major root cause is doing all EDA processes before splitting the dataset into test and train
- Doing straightforward normalizing or rescaling on a given dataset
- Performing Min/Max values of a feature
- Handling missing values without reserving the test and train
- Removing outliers and Anomaly on a given dataset
- Applying standard scaler, scaling, assert normal distribution on the full dataset
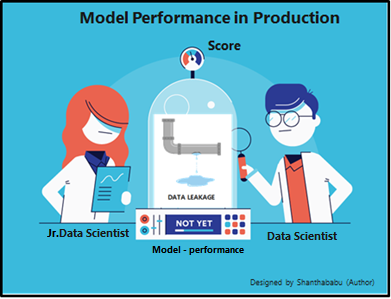
Bottom line is, we should avoid doing anything to our training dataset that involves having knowledge of the test dataset. So that our model will perform in production as a generalised model.
will go through the available Hyperparameters across the various algorithms and how we could implement all these factors and impact the model.
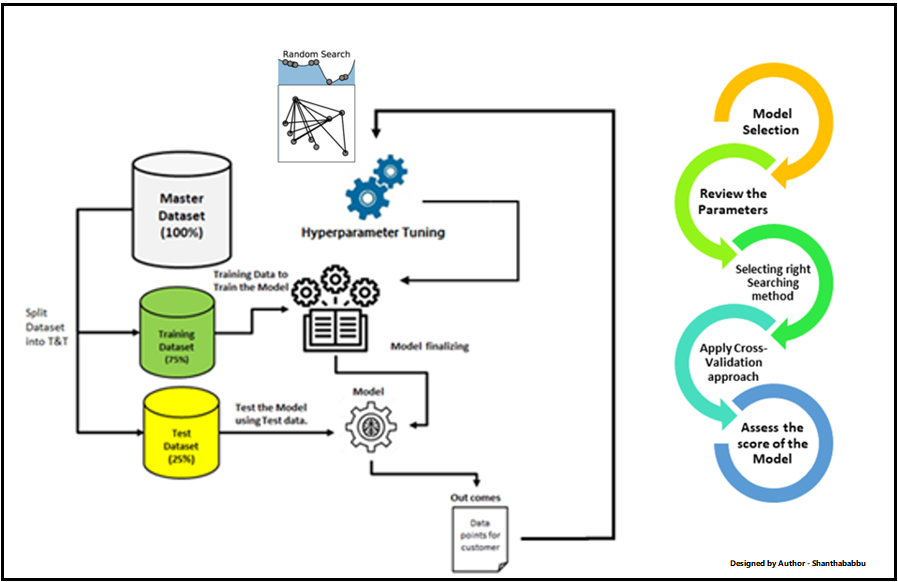
Steps to Perform Hyperparameter Tuning
- Select the right type of model.
- Review the list of parameters of the model and build the HP space
- Finding the methods for searching the hyperparameter space
- Applying the cross-validation scheme approach
- Assess the model score to evaluate the model
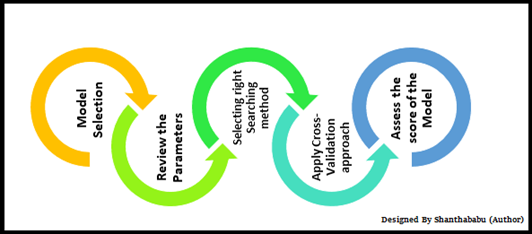
Image designed by the author – Shanthababu
Now, time to discuss a few Hyperparameters and their influence on the model.
Train, Test Split Estimator: With the help of this, we use to set the test and train size for the given dataset and along with random state, this is permutations to generate the same set of splits., otherwise you will get a different set of test and train sets, tracing your model during evaluation is bit complex or if we omitted this system will generate this number and leads to unpredictable behaviour of the model. The random state provides the seed, for the random number generator, in order to stabilize the model.
train_test_split( X, y, test_size=0.4, random_state=0)
Logistic Regression Classifier: The parameter C in Logistic Regression Classifier is directly related to the regularization parameter λ but is inversely proportional to C=1/λ.
LogisticRegression(C=1000.0, random_state=0)LogisticRegression(C=1000.0, random_state=0)
KNN (k-Nearest Neighbors) Classifier: As we know the k-nearest neighbour’s algorithm (KNN) is a non-parametric method used for regression and classification problems. Predominantly this is used for classification problems, in which the number of neighbours and power parameter
KNeighborsClassifier(n_neighbors=5, p=2, metric=’minkowski’)
– n_neighbors is the number of neighbors
– p is Minkowski (the power parameter)
If p = 1 Equivalent to manhattan_distance,
p = 2. For Euclidean_distance
Support Vector Machine Classifier
SVC(kernel=’linear’, C=1.0, random_state=0)
– kernel specifies the kernel type to be used in the chosen algorithm,
kernel = ‘linear’, for Linear Classification
kernel = ‘rbf’ for Non-Linear Classification.
C is the penalty parameter (error)
random_state is a pseudo-random number generator
Decision Tree Classifier
Here, the criterion is the function to measure the quality of a split, max_depth is the maximum depth of the tree, and random_state is the seed used by the random number generator.
DecisionTreeClassifier(criterion=’entropy’, max_depth=3, random_state=0)
Lasso Regression
Lasso(alpha = 0.1) the regularization parameter is alpha.
Principal Component Analysis
PCA(n_components = 4)
Perceptron Classifier
Perceptron (n_iter=40, eta0=0.1, random_state=0)
– n_iter is the number of iterations,
-eta0 is the learning rate,
-random_state is random number generator.
Influencing on Models
Overall, Hyperparameters are influencing the below factors while designing your model. Please remember this.
- Linear Model
- What degree of polynomial features should use?
- Decision Tree
- What is the maximum allowed depth?
- What is the minimum number of samples required at a leaf node in the decision tree?
- Random forest
- How many trees we should include?
- Neural Network
- How many neurons we should keep in a layer?
- How many layers, should keep in a layer?
- Gradient Descent
- What learning rate should we?
So, once we started thinking about introducing the hyperparameters in our model then the overall architecture model would be like below.
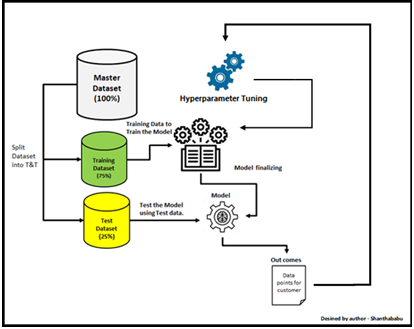
Image designed by the author – Shanthababu
Hyperparameter Optimization Techniques
In the ML world, there are many Hyperparameter optimization techniques are available.
- Manual Search
- Random Search
- Grid Search
- Halving
- Grid Search
- Randomized Search
- Automated Hyperparameter tuning
- Bayesian Optimization
- Genetic Algorithms
- Artificial Neural Networks Tuning
- HyperOpt-Sklearn
- Bayes Search
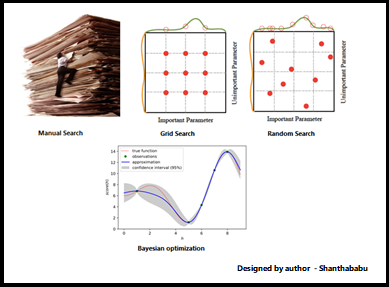
Note: When we implement Hyperparameters optimization techniques, we have to have the Cross-Validation techniques as well in the flow because we may not miss out on the best combinations that work on tests and training.
Manual Search: The name itself is self-explanatory that the data scientist can do the experiment with different combinations of hyperparameters and its values for the selected model perform the training and pick up the best model with the best performance and go for testing and move on to production deployment. Of Course, what you think is absolutely right is that this method will consume immense effort.
Let’s try this with a simple dataset
Dataframe ready after load CSV and required libraries for further operations
# Train Test Split
#df = df.drop(['name','origin','model_year'], axis=1)
y = df['class']
X = df.drop(['class'],axis=1)
X_train, X_test, y_train, y_test = train_test_split(X, y, test_size=0.3, random_state=30)
Train and Test are done with target and dependent variables identification.
Since we’re planning for manual search, I am creating 3 sets for DecisionTreeClassifier and fitting the model
# sets of hyperparameters
params_1 = {'criterion': 'gini', 'splitter': 'best', 'max_depth': 50}
params_2 = {'criterion': 'entropy', 'splitter': 'random', 'max_depth': 70}
params_3 = {'criterion': 'gini', 'splitter': 'random', 'max_depth': 60}
params_4 = {'criterion': 'entropy', 'splitter': 'best', 'max_depth': 80}
params_5 = {'criterion': 'gini', 'splitter': 'best', 'max_depth': 40}
# Separate models
model_1 = DecisionTreeClassifier(**params_1)
model_2 = DecisionTreeClassifier(**params_2)
model_3 = DecisionTreeClassifier(**params_3)
model_4 = DecisionTreeClassifier(**params_4)
model_5 = DecisionTreeClassifier(**params_5)
model_1.fit(X_train, y_train)
model_2.fit(X_train, y_train)
model_3.fit(X_train, y_train)
model_4.fit(X_train, y_train)
model_5.fit(X_train, y_train)
# Prediction sets
preds_1 = model_1.predict(X_test)
preds_2 = model_3.predict(X_test)
preds_3 = model_3.predict(X_test)
preds_4 = model_4.predict(X_test)
preds_5 = model_5.predict(X_test)
print(f'Accuracy on Model 1: {round(accuracy_score(y_test, preds_1), 3)}')
print(f'Accuracy on Model 2: {round(accuracy_score(y_test, preds_2), 3)}')
print(f'Accuracy on Model 3: {round(accuracy_score(y_test, preds_3), 3)}')
print(f'Accuracy on Model 4: {round(accuracy_score(y_test, preds_4), 3)}')
print(f'Accuracy on Model 5: {round(accuracy_score(y_test, preds_5), 3)}')
Output
Accuracy on Model 1: 0.693
Accuracy on Model 2: 0.693
Accuracy on Model 3: 0.693
Accuracy on Model 4: 0.736
Accuracy on Model 5: 0.688
Look at the accuracy and its differences with different parameters that we have passed over the list. But this is a tedious job and running behind a number of permutations and combinations and finding the best one, hope you can understand the pain and code management.
Grid-Search: To implement the Grid-Search, we have a Scikit-Learn library called GridSearchCV. The computational time would be long, but it would reduce the manual efforts by avoiding the ‘n’ number of lines of code. Library itself perform the search operations and returns the performing model and its score. In which each model are built for each permutation of a given hyperparameter, internally it would be evaluated and ranked across the given cross-validation folds.
Let’s implement this with the given dataset.
Getting KNeighborsClassifier object for my operation.
from sklearn.neighbors import KNeighborsClassifier
knn_clf = KNeighborsClassifier()
Assigning my Train and Test spilt to my KNN object
knn_clf.fit(X_train, y_train)
Output
KNeighborsClassifier()
Importing other required libraries
from sklearn.metrics import accuracy_score
from sklearn.model_selection import GridSearchCV
Defining a number of folders for GridSearchCV and assigning TT.
gs = GridSearchCV(knn_clf,param_grid,cv=10)
gs.fit(X_train, y_train)
Preparing a list of hyperparameters for my further actions with 4 different algorithm
Output
GridSearchCV(cv=10, estimator=KNeighborsClassifier(),param_grid={'algorithm': ('auto', 'ball_tree', 'kd_tree', 'brute'),'n_neighbors': [1, 2, 3, 4, 5, 6, 7, 8]})
We will print all 4 algorithms for 8 sub-sets.
gs.cv_results_['params']
Output 32 combinations
[{'algorithm': 'auto', 'n_neighbors': 1},
 {'algorithm': 'auto', 'n_neighbors': 2},
 {'algorithm': 'auto', 'n_neighbors': 3},
 {'algorithm': 'auto', 'n_neighbors': 4},
 {'algorithm': 'auto', 'n_neighbors': 5},
 {'algorithm': 'auto', 'n_neighbors': 6},
 {'algorithm': 'auto', 'n_neighbors': 7},
 {'algorithm': 'auto', 'n_neighbors': 8},
 {'algorithm': 'ball_tree', 'n_neighbors': 1},
 {'algorithm': 'ball_tree', 'n_neighbors': 2},
 {'algorithm': 'ball_tree', 'n_neighbors': 3},
 {'algorithm': 'ball_tree', 'n_neighbors': 4},
 {'algorithm': 'ball_tree', 'n_neighbors': 5},
 {'algorithm': 'ball_tree', 'n_neighbors': 6},
 {'algorithm': 'ball_tree', 'n_neighbors': 7},
 {'algorithm': 'ball_tree', 'n_neighbors': 8},
 {'algorithm': 'kd_tree', 'n_neighbors': 1},
 {'algorithm': 'kd_tree', 'n_neighbors': 2},
 {'algorithm': 'kd_tree', 'n_neighbors': 3},
 {'algorithm': 'kd_tree', 'n_neighbors': 4},
 {'algorithm': 'kd_tree', 'n_neighbors': 5},
 {'algorithm': 'kd_tree', 'n_neighbors': 6},
 {'algorithm': 'kd_tree', 'n_neighbors': 7},
 {'algorithm': 'kd_tree', 'n_neighbors': 8},
 {'algorithm': 'brute', 'n_neighbors': 1},
 {'algorithm': 'brute', 'n_neighbors': 2},
 {'algorithm': 'brute', 'n_neighbors': 3},
 {'algorithm': 'brute', 'n_neighbors': 4},
 {'algorithm': 'brute', 'n_neighbors': 5},
 {'algorithm': 'brute', 'n_neighbors': 6},
 {'algorithm': 'brute', 'n_neighbors': 7},
 {'algorithm': 'brute', 'n_neighbors': 8}]
Let’s get the best parameter from the list
gs.best_params_
Output
{'algorithm': 'auto', 'n_neighbors': 6}
As per the Cross-Validation process, will figure out the mean and get the results
gs.cv_results_['mean_test_score']
Output
array([0.68134172, 0.71701607, 0.71331237, 0.71509434, 0.72075472,
       0.73944794, 0.72085954, 0.73392732, 0.68134172, 0.71701607,
       0.71331237, 0.71509434, 0.72075472, 0.73944794, 0.72085954,
       0.73392732, 0.68134172, 0.71701607, 0.71331237, 0.71509434,
       0.72075472, 0.73944794, 0.72085954, 0.73392732, 0.68134172,
       0.71701607, 0.71331237, 0.71509434, 0.72075472, 0.73944794,
       0.72085954, 0.73392732])
That’s fine. which one is the best accuracy from the above list, this is simple, already we found the best parameter from the list is {‘algorithm’: ‘auto’, ‘n_neighbors’: 6}, So compare the 32 combinations of different parameters and accuracy list. this answer is 0.73944794. is the highest value among the list and this is the BEST accuracy of the training model.
Best accuracy from training
print(gs.score(X_test,y_test))
Output
0.70129870
Random Search: The Grid Search one that we have discussed above usually increases the complexity in terms of the computation flow, So sometimes GS is considered inefficient since it attempts all the combinations of given hyperparameters. But the Randomized Search is used to train the models based on random hyperparameters and combinations. obviously, the number of training models are small column than grid search.
In simple terms, In Random Search, in a given grid, the list of hyperparameters are trained and test our model on a random combination of given hyperparameters.
Getting RandomForestClassifier object for my operation.
Assigning my Train and Test spilt to my RandomForestClassifier object
# build a RandomForestClassifier
clf = RandomForestClassifier(n_estimators=50)
Specifying the list of parameters and distributions
param_dist = {"max_depth": [3, None],
              "max_features": sp_randint(1, 11),
              "min_samples_split": sp_randint(2, 11),
              "min_samples_leaf": sp_randint(1, 11),
              "bootstrap": [True, False],
              "criterion": ["gini", "entropy"]}
Defining the sample, distributions and cross-validation
samples = 8  # number of random samples
randomCV = RandomizedSearchCV(clf, param_distributions=param_dist, n_iter=samples,cv=3)
All parameters are set and, let’s do the fit model
randomCV.fit(X, y)
print(randomCV.best_params_)
Output
{'bootstrap': False, 'criterion': 'gini', 'max_depth': 3, 'max_features': 3, 'min_samples_leaf': 7, 'min_samples_split': 8}
As per the Cross-Validation process, will figure out the mean and get the results
randomCV.cv_results_['mean_test_score']
Output
array([0.73828125, 0.69010417, 0.7578125 , 0.75911458, 0.73828125,
              nan,        nan, 0.7421875 ])
Best accuracy from training
print(randomCV.score(X_test,y_test))
Output
0.8744588744588745
You may have a question, now which technique is best to go. The straight answer is RandomSearshCV, let’s see why?
Comparison Study of GridSearchCV and RandomSearshCV
| GridSearchCV |
RandomSearshCV |
| Grid is well-defined | Grid is not well defined |
| Discrete values for HP-params | Continuos values and Statistical distribution |
| Defined size for Hyperparameter space | No such a restriction |
| Picks of the best combination from HP-Space | Picks up the samples from HP-Space |
| Samples are not created | Samples are created and specified by the range and n_iter |
| Low performance than RSCV | Better performance and result |
| Guided flow to search for the best combination | The name itself says that, no guidance. |
The blow pictorial representation would give you the best understanding of GridSearchCV and RandomSearshCV.
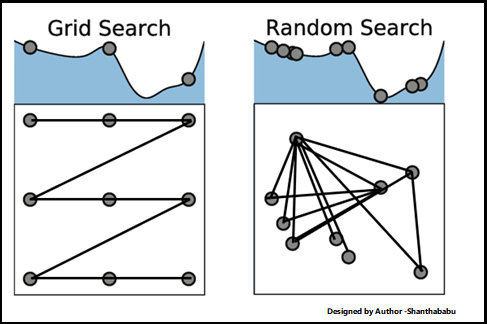
Conclusion
Guys! So far we have discussed in a detailed study of Hyperparameter visions with respect to the Machine Learning point of view, please remember a few things before we go
- Each model has a set of hyperparameters, so we have carefully chosen them and tweaked them during hyperparameter tuning. I mean building the HP space.
- All hyperparameters are NOT equally important and no defined rules for this. try to use continuous values instead of discrete values.
- Make sure to use K-Fold while using Hyperparameter tuning to improvise your hyperparameter tuning and coverage of hyperparameter space.
- Go with a better combination for hyperparameters and build strong results.
I trust, this article helps you to understand the concepts and ways to implement the same.
Thanks for the time and will connect on different topics. Until then Bye! Cheers! – Shanthababu
The media shown in this article is not owned by Analytics Vidhya and are used at the Author’s discretion.


