Introduction
Working as an ML engineer, it is common to be in situations where you spend hours to build a great model with desired metrics after carrying out multiple iterations and hyperparameter tuning but cannot get back to the same results with the same model only because you missed to record one small hyperparameter.
What could save one from such situations is keeping a track of the experiments you carry out in the process of solving an ML problem.
- If you have worked in any ML project, you would know that the most challenging part is to arrive at good performance – which makes it necessary to carry out several experiments tweaking different parameters and tracking each of those.
- You don’t want to waste time looking for that one good model you got in the past – a repo of all the experiments you carried out in the past makes it hassle-free.
- Just a small change in alpha and the model accuracy touches the roof – capturing the small changes we make in our model & their associated metrics saves a lot of time.
- All your experiments under one roof – experiment tracking helps in comparing all the different runs you carry out by bringing all the information under one roof.
Should we just track the machine learning model parameters?
Well, No. When you run any ML experiment, you should ideally track multiple numbers of things to enable reproducing experiments and arriving at an optimized model:
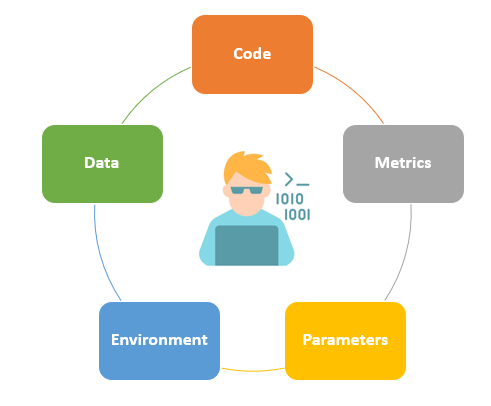
- Code: Code that is used for running the experiments
- Data: Saving versions of the data used for training and evaluation
- Environment: Saving the environment configuration files like ‘Dockerfile’,’requirements.txt’ etc.
- Parameters: Saving the various hyperparameters used for the model.
- Metrics: Logging training and validation metrics for all experimental runs.
Why not use an excel sheet?
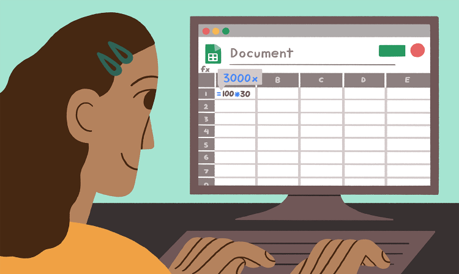
Spreadsheets are something we all love as it’s just so handy! However, recording all the information about the experiments in a spreadsheet is feasible only when we carry out a limited number of iterations.
Whether you are a beginner or an expert in data science, you would know how tedious the process of building an ML model is with so many things going on simultaneously like multiple versions of the data, different model hyperparameters, numerous notebook versions, etc. which make it unfeasible to go for manual recording.
Fortunately, there are many tools available to help you. Neptune is one such tool that can help us track all our ML experiments within a project.
Let’s see it in action!
Install Neptune in Python
In order to install Neptune, we could run the following command:
pip install neptune-client
For importing the Neptune client, we could use the following line:
import neptune.new as Neptune
Does it need credentials?
We need to pass our credentials to the neptune.init() method to enable logging metadata to Neptune.
run = neptune.init(project='',api_token='')
We can create a new project by logging into https://app.neptune.ai/ and then fetch the project name and API token.
Logging the parameters in Neptune
We use the iris dataset here and apply a random forest classifier to the dataset. We consequently log the parameters of the models, metrics using Neptune.
from sklearn.datasets import load_iris
from sklearn.ensemble import RandomForestClassifier
from sklearn.model_selection import train_test_split
from sklearn.metrics import f1_score
from joblib import dump
data = load_iris()
X_train, X_test, y_train, y_test = train_test_split(data.data,
                                                    data.target,
                                                    test_size=0.4,
                                                   random_state=1234)
params = {'n_estimators': 10,
          'max_depth': 3,
          'min_samples_leaf': 1,
          'min_samples_split': 2,
          'max_features': 3,
          }
clf = RandomForestClassifier(**params)
clf.fit(X_train, y_train)
y_train_pred = clf.predict_proba(X_train)
y_test_pred = clf.predict_proba(X_test)
train_f1 = f1_score(y_train, y_train_pred.argmax(axis=1), average='macro')
test_f1 = f1_score(y_test, y_test_pred.argmax(axis=1), average='macro')
To log the parameters of the above model, we could use the run object that we initiated before as below:
run['parameters'] = params
Neptune also allows code and environment tracking while creating the run object as follows:
run = neptune.init(project=' stateasy005/iris',api_token='', source_files=['*.py', 'requirements.txt'])
Can I log the metrics as well?
The training & evaluation metrics can be logged again using the run object we created:
run['train/f1'] = train_f1
run['test/f1'] = test_f1
Shortcut to log everything at once?
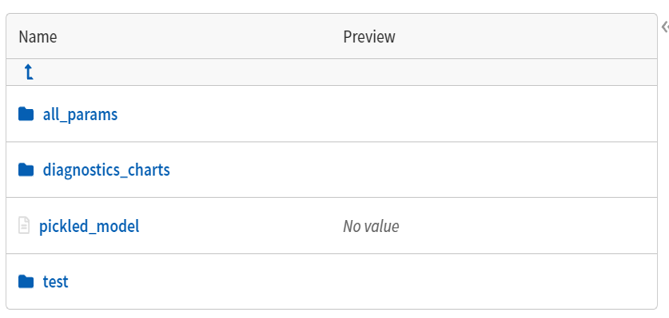
We can create a summary of our classifier model that will by itself capture different parameters of the model, diagnostics charts, a test folder with the actual predictions, prediction probabilities, and different scores for all the classes like precision, recall, support, etc.
This summary can be obtained using the following code:
import neptune.new.integrations.sklearn as npt_utils
run["cls_summary "] = npt_utils.create_classifier_summary(clf, X_train, X_test, y_train, y_test)
This leads to the creation of the following
folders on the Neptune UI as shown below:
What’s inside the Folders?
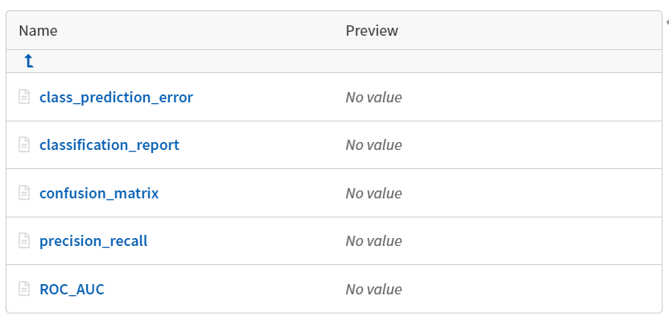
The ‘diagnostic charts’ folder comes in handy as one can assess their experiments using multiple metrics just with one line of code on the classifier summary.
The ‘all_params’ folder comprises the different hyperparameters of the model. These hyperparameters help one to compare how the model performs at a set of values and post tuning them by some levels. The tracking of the hyperparameters additionally helps one to go back to the exact same model (with the same values of hyperparameters) when one needs to.
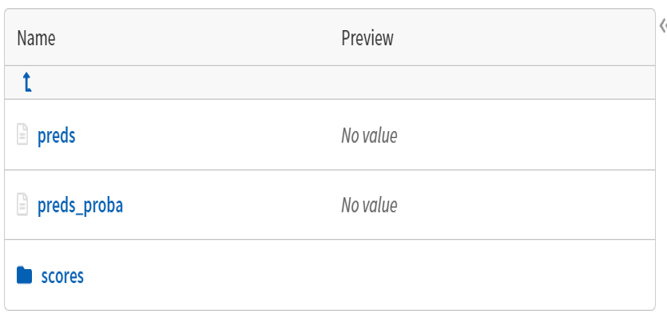
The trained model also gets saved in the form of a ‘.pkl’ file which can be fetched later to use. The ‘test’ folder contains the predictions, prediction probabilities, and the scores on the test dataset.
How about Regression & Clustering using Neptune
We can get a similar summary if we have a regression model using the following lines:
import neptune.new.integrations.sklearn as npt_utils
run['rfr_summary'] = npt_utils.create_regressor_summary(rfr, X_train, X_test, y_train, y_test)
Similarly, for clustering as well, we can create a summary with the help of the following lines of code:
import neptune.new.integrations.sklearn as npt_utils
run['kmeans_summary'] = npt_utils.create_kmeans_summary(km, X, n_clusters=5)
Here, km is the name of the k-means model.
How do I upload my data on Neptune?
We can also log csv files to a run and see them on the Neptune UI using the following lines of code:
run['test/preds'].upload('path/to/test_preds.csv')
Uploading Artifacts to Neptune
Any figure that one plot using libraries like matplotlib, plotly etc. can be logged as well to Neptune.
import matplotlib.pyplot as plt
plt.plot(data)
run["dataset/distribution"].log(plt.gcf())
In order to download the same files later programmatically, we can use the download method of ‘run’ object using the following line of code:
run['artifacts/images'].download()
Final Thoughts
In this article, I tried to cover why experiment tracking is crucial and how Neptune can help facilitate that consequently leading to an increase in productivity while conducting different ML experiments for your projects. This article was focused on ML experiment tracking but we can carry out code versioning, notebook versioning, data versioning, environment versioning as well with Neptune.
There are of course many similar libraries available online for tracking the runs which I would try to cover in my next articles.
About Author
Nibedita is a master’s in Chemical Engineering from IIT Kharagpur and currently working as a Senior Consultant at AbsolutData Analytics. In her current capacity, she works on building AI/ML-based solutions for clients from an array of industries.
Image Source
Image 1: https://tinyurl.com/em429czk


