This article concerns one of the supervised ML classification algorithm-KNN(K Nearest Neighbors) algorithm. It is one of the simplest and widely used classification algorithms in which a new data point is classified based on similarity in the specific group of neighboring data points. This gives a competitive result.
Working
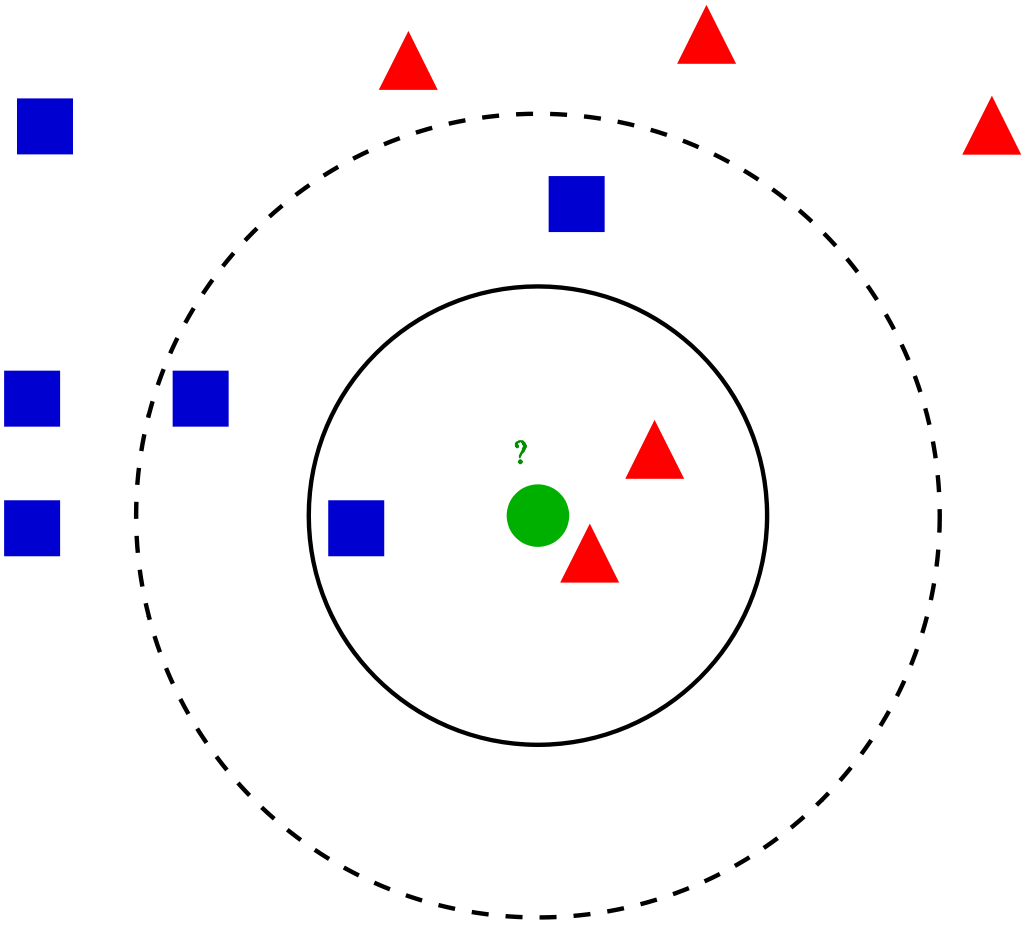
For a given data point in the set, the algorithms find the distances between this and all other K numbers of datapoint in the dataset close to the initial point and votes for that category that has the most frequency. Usually, Euclidean distance is taking as a measure of distance. Thus the end resultant model is just the labeled data placed in a space. This algorithm is popularly known for various applications like genetics, forecasting, etc. The algorithm is best when more features are present and out shows SVM in this case.
KNN reducing overfitting is a fact. On the other hand, there is a need to choose the best value for K. So now how do we choose K? Generally we use the Square root of the number of samples in the dataset as value for K. An optimal value has to be found out since lower value may lead to overfitting and higher value may require high computational complication in distance. So using an error plot may help. Another method is the elbow method. You can prefer to take root else can also follow the elbow method.
Let’s dive deep into the different steps of K-NN for classifying a new data point
Step 1: Select the value of K neighbors(say k=5)
Step 2: Find the K (5) nearest data point for our new data point based on euclidean distance(which we discuss later)
Step 3: Among these K data points count the data points in each category
Step 4: Assign the new data point to the category that has the most neighbors of the new datapoint

Example
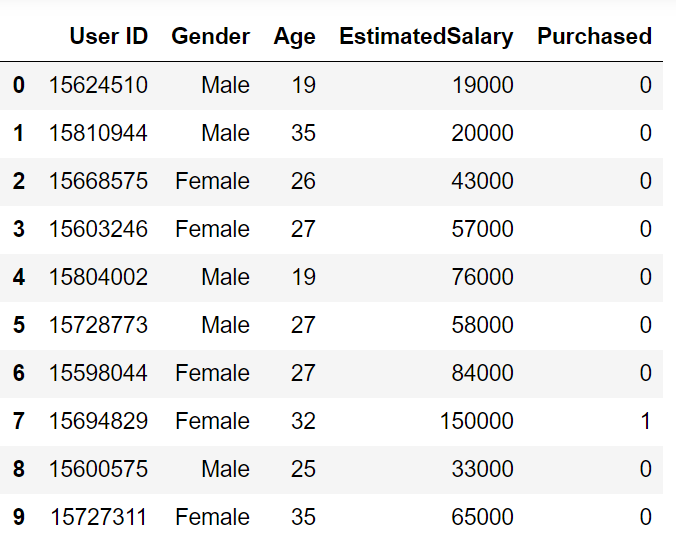
Let’s go through an example problem for getting a clear intuition on the K -Nearest Neighbor classification. We are using the Social network ad dataset (Download). The dataset contains the details of users in a social networking site to find whether a user buys a product by clicking the ad on the site based on their salary, age, and gender.

import numpy as np
import matplotlib.pyplot as plt
import pandas as pd
import sklearn
dataset = pd.read_csv('Social_Network_Ads.csv')
X = dataset.iloc[:, [1, 2, 3]].values
y = dataset.iloc[:, -1].values
from sklearn.preprocessing import LabelEncoder
le = LabelEncoder()
X[:,0] = le.fit_transform(X[:,0])
from sklearn.model_selection import train_test_split
X_train, X_test, y_train, y_test = train_test_split(X, y, test_size = 0.20, random_state = 0)
from sklearn.preprocessing import StandardScaler
sc = StandardScaler()
X_train = sc.fit_transform(X_train)
X_test = sc.transform(X_test)
from sklearn.neighbors import KNeighborsClassifier
classifier = KNeighborsClassifier(n_neighbors = 5, metric = 'minkowski', p = 2)
classifier.fit(X_train, y_train)

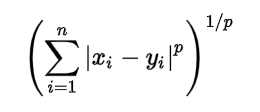
As per the equation, we have to select the p-value also.
y_pred = classifier.predict(X_test)
Comparing true and predicted value :
y_test
array([0, 0, 0, 0, 0, 0, 0, 1, 0, 0, 0, 0, 0, 0, 0, 0, 0, 0, 1, 0, 0, 1,
       0, 1, 0, 1, 0, 0, 0, 0, 0, 1, 1, 0, 0, 0, 0, 0, 0, 1, 0, 0, 0, 0,
       1, 0, 0, 1, 0, 1, 1, 0, 0, 0, 1, 1, 0, 0, 1, 0, 0, 1, 0, 1, 0, 1,
       0, 0, 0, 0, 1, 0, 0, 1, 0, 0, 0, 0, 1, 1, 1, 0, 0, 0, 1, 1, 0, 1,
       1, 0, 0, 1, 0, 0, 0, 1, 0, 1, 1, 1], dtype=int64)
y_pred
array([0, 0, 0, 0, 0, 0, 0, 1, 0, 1, 0, 0, 0, 0, 0, 1, 0, 0, 1, 0, 0, 1,
       0, 1, 0, 1, 0, 0, 0, 0, 0, 0, 1, 0, 0, 0, 0, 0, 0, 1, 0, 0, 0, 0,
       1, 0, 0, 1, 0, 1, 1, 0, 0, 1, 1, 1, 0, 0, 1, 0, 0, 1, 0, 1, 0, 1,
       0, 0, 0, 0, 1, 0, 0, 1, 0, 0, 0, 0, 1, 1, 1, 1, 0, 0, 1, 0, 0, 1,
       1, 0, 0, 1, 0, 0, 0, 0, 0, 1, 1, 1], dtype=int64)
from sklearn.metrics import confusion_matrix,accuracy_score
cm = confusion_matrix(y_test, y_pred)
ac = accuracy_score(y_test,y_pred)
confusion matrix –
[[64  4]
 [ 3 29]]
accuracy is 0.95
Our model is performing well. The full code for the problem is given below.
# Importing the libraries
import numpy as np
import matplotlib.pyplot as plt
import pandas as pd

# Importing the dataset
dataset = pd.read_csv('Social_Network_Ads.csv')
X = dataset.iloc[:, [2, 3]].values
y = dataset.iloc[:, -1].values

# Splitting the dataset into the Training set and Test set
from sklearn.model_selection import train_test_split
X_train, X_test, y_train, y_test = train_test_split(X, y, test_size = 0.20, random_state = 0)

# Feature Scaling
from sklearn.preprocessing import StandardScaler
sc = StandardScaler()
X_train = sc.fit_transform(X_train)
X_test = sc.transform(X_test)

# Training the K-NN model on the Training set
from sklearn.neighbors import KNeighborsClassifier
classifier = KNeighborsClassifier(n_neighbors = 5, metric = 'minkowski', p = 2)
classifier.fit(X_train, y_train)

# Predicting the Test set results
y_pred = classifier.predict(X_test)

# Making the Confusion Matrix
from sklearn.metrics import confusion_matrix, accuracy_score
cm = confusion_matrix(y_test, y_pred)
ac = accuracy_score(y_test, y_pred)
Conclusion
We covered the main concepts behind the K Nearest Neighbor algorithm. Take different datasets and get familiar with this algorithm. In the upcoming articles, we can discuss more algorithms.
The media shown in this article are not owned by Analytics Vidhya and is used at the Author’s discretion.


