

Google Sheets has long been a go-to tool for organizing and manipulating data. Recently, it received a significant upgrade with the integration of Gemini. Google’s AI acts as your intelligent data partner, capable of analyzing vast datasets with remarkable speed and precision. Let me show you how this powerful AI can transform your data analysis workflow and let you move beyond the basics of formulas and functions.
Whether you analyze sales figures, track marketing campaigns, or manage financial data, Gemini helps you transform those raw numbers into strategic advantages. Since Google Sheets is a web tool, you can access it on your Windows desktop, Mac, Linux PC, and Chromebook.
Related
Unlock Gemini in Google Sheets
Before we start, subscribe to the Gemini Advanced plan. It unlocks Gemini in all the Workspace apps, including Docs, Slides, Drive, Gmail, and Sheets. The Gemini Advanced plan is priced at $20 per month. The search giant is offering a month of free trial to all new signups.
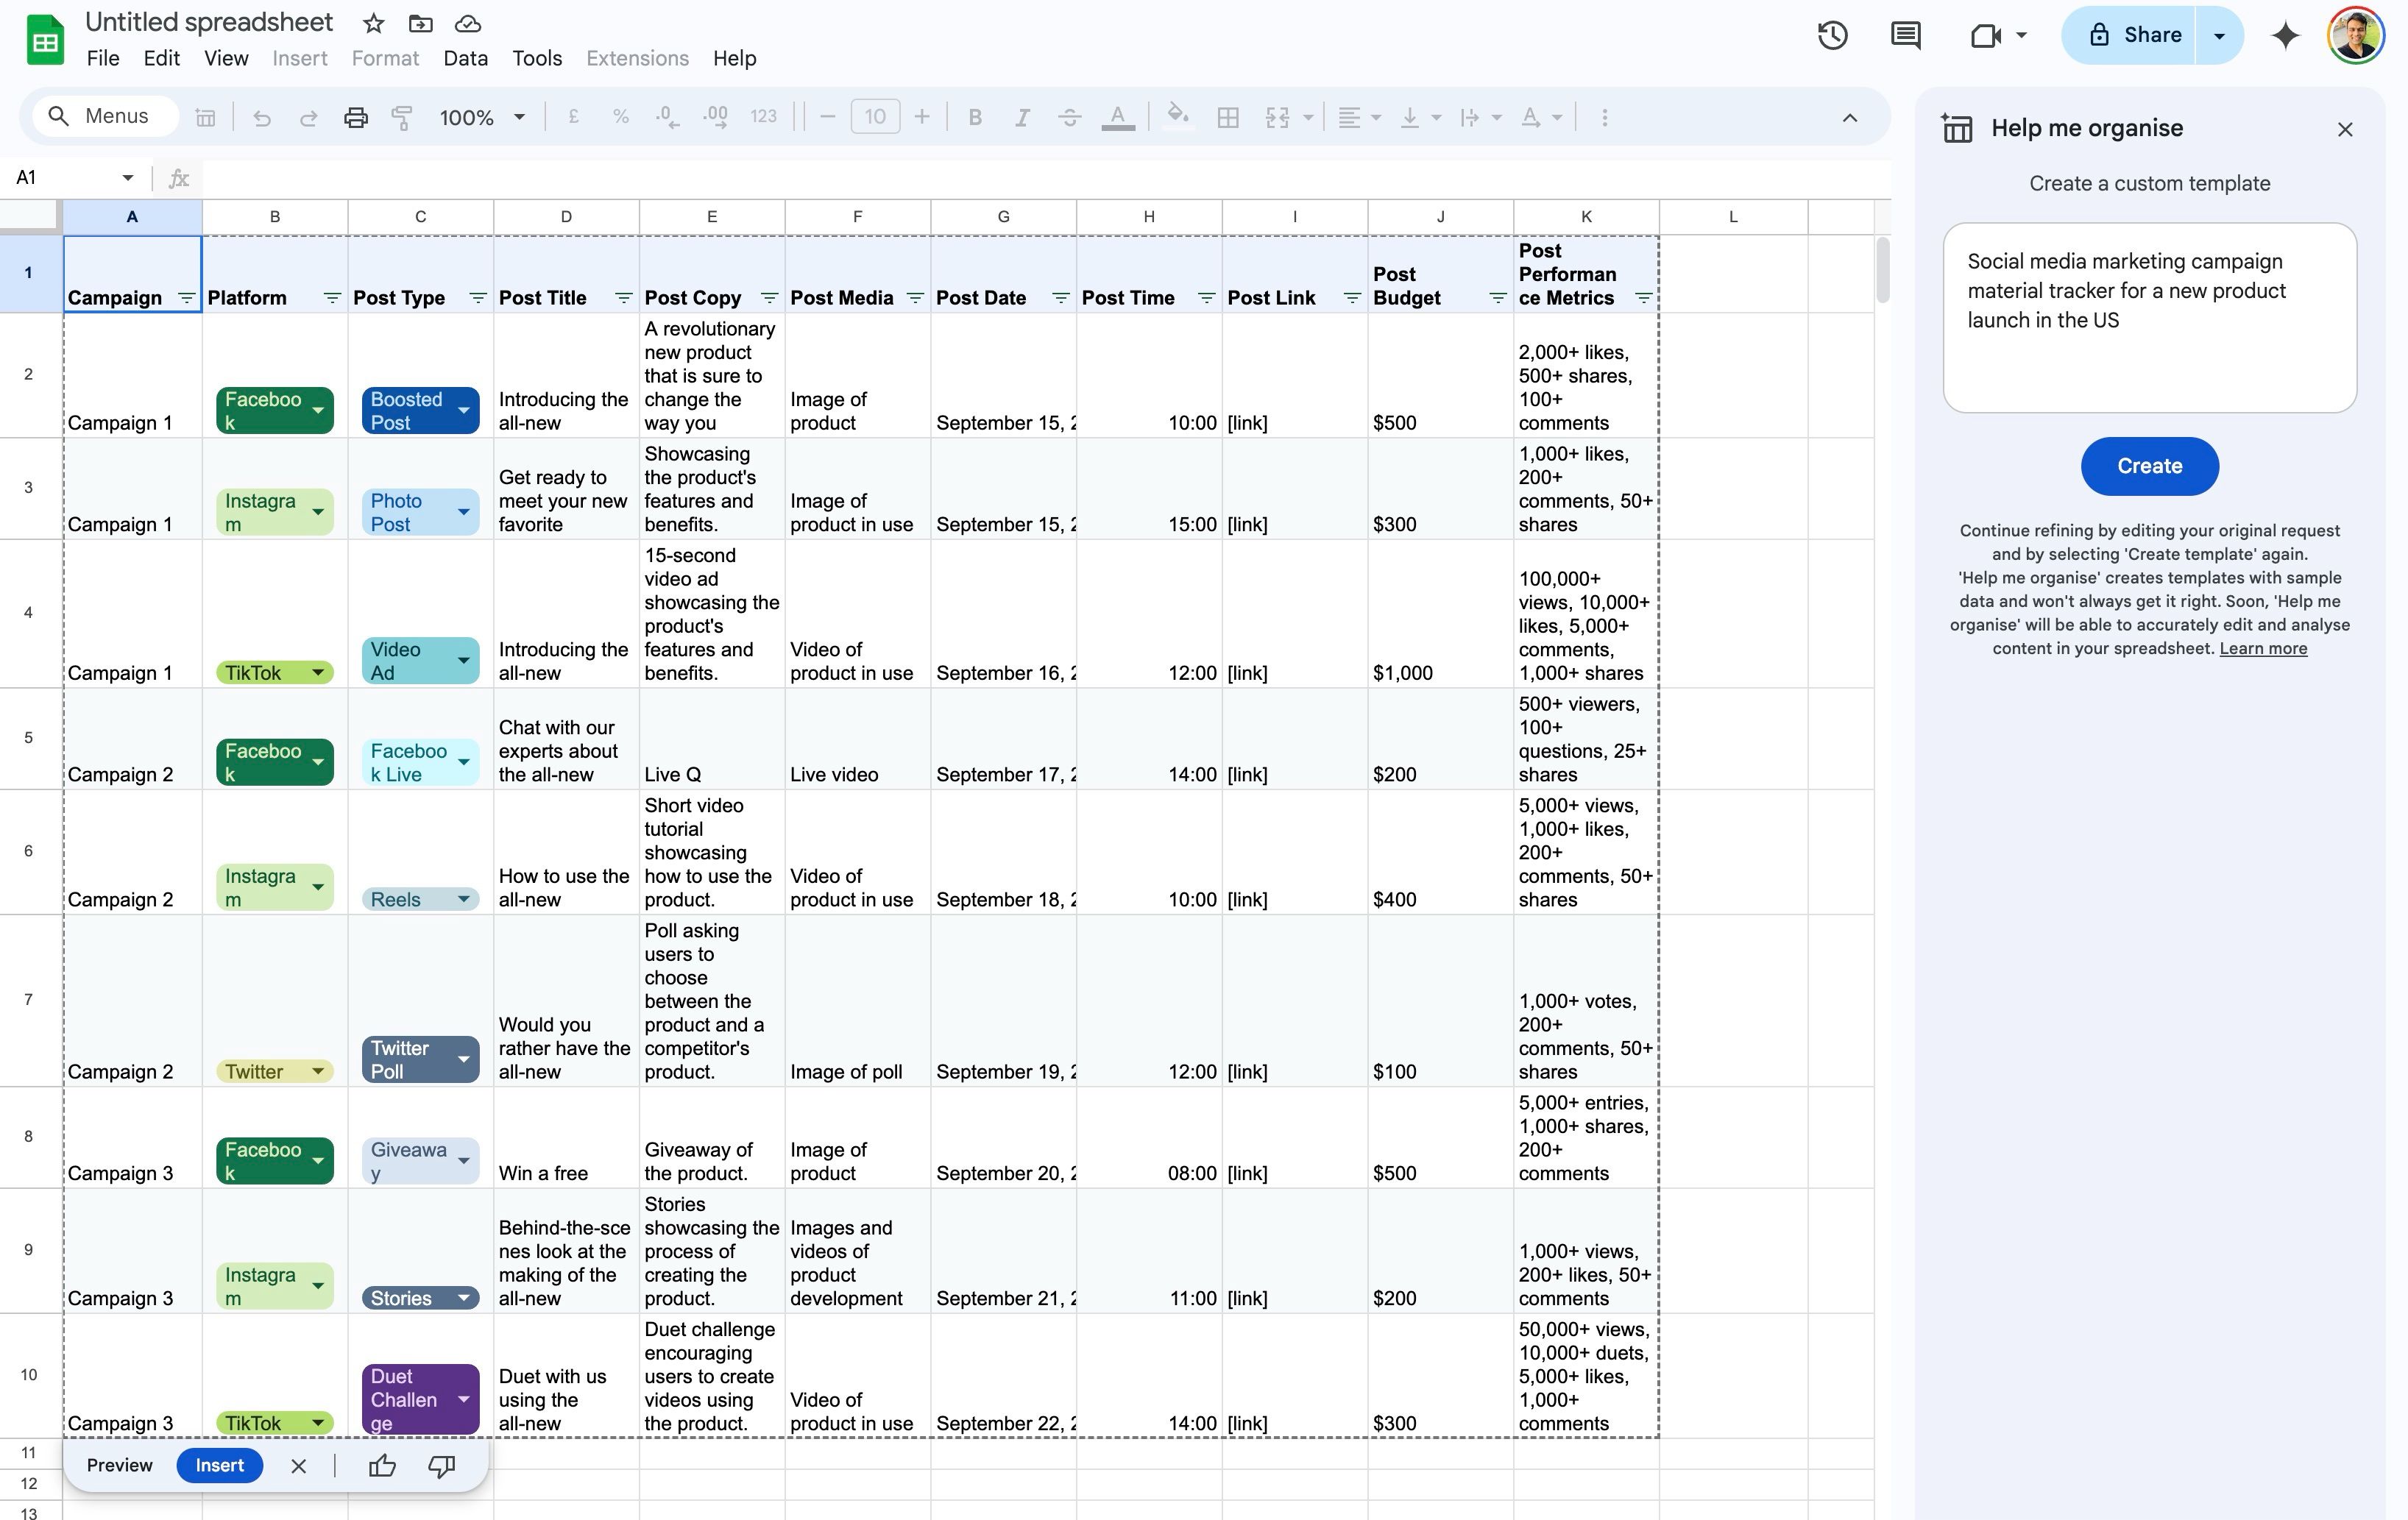
After subscribing to Gemini Advanced, go to Google Sheets, open an existing spreadsheet, and look for the Gemini icon in the upper-right corner. You can all set to utilize Google’s cutting-edge AI in your spreadsheets. Let’s check it in action.
5
Get data insights from sales reports
Gemini supports natural language prompts and allows you to request summaries in a conversational manner. For example, you can ask it to Summarize the key findings from this sales data table or Give me a brief overview of the customer feedback in this sheet and get the required results in no time.
It can identify key trends, patterns, and outliers and include them in the summary. I opened a sales spreadsheet with relevant data and selected the Summarize this table button at the top. It quickly gave me a neat overview of the table. Instead of reviewing it manually, Gemini produced a short, easy-to-understand summary with the most important information.
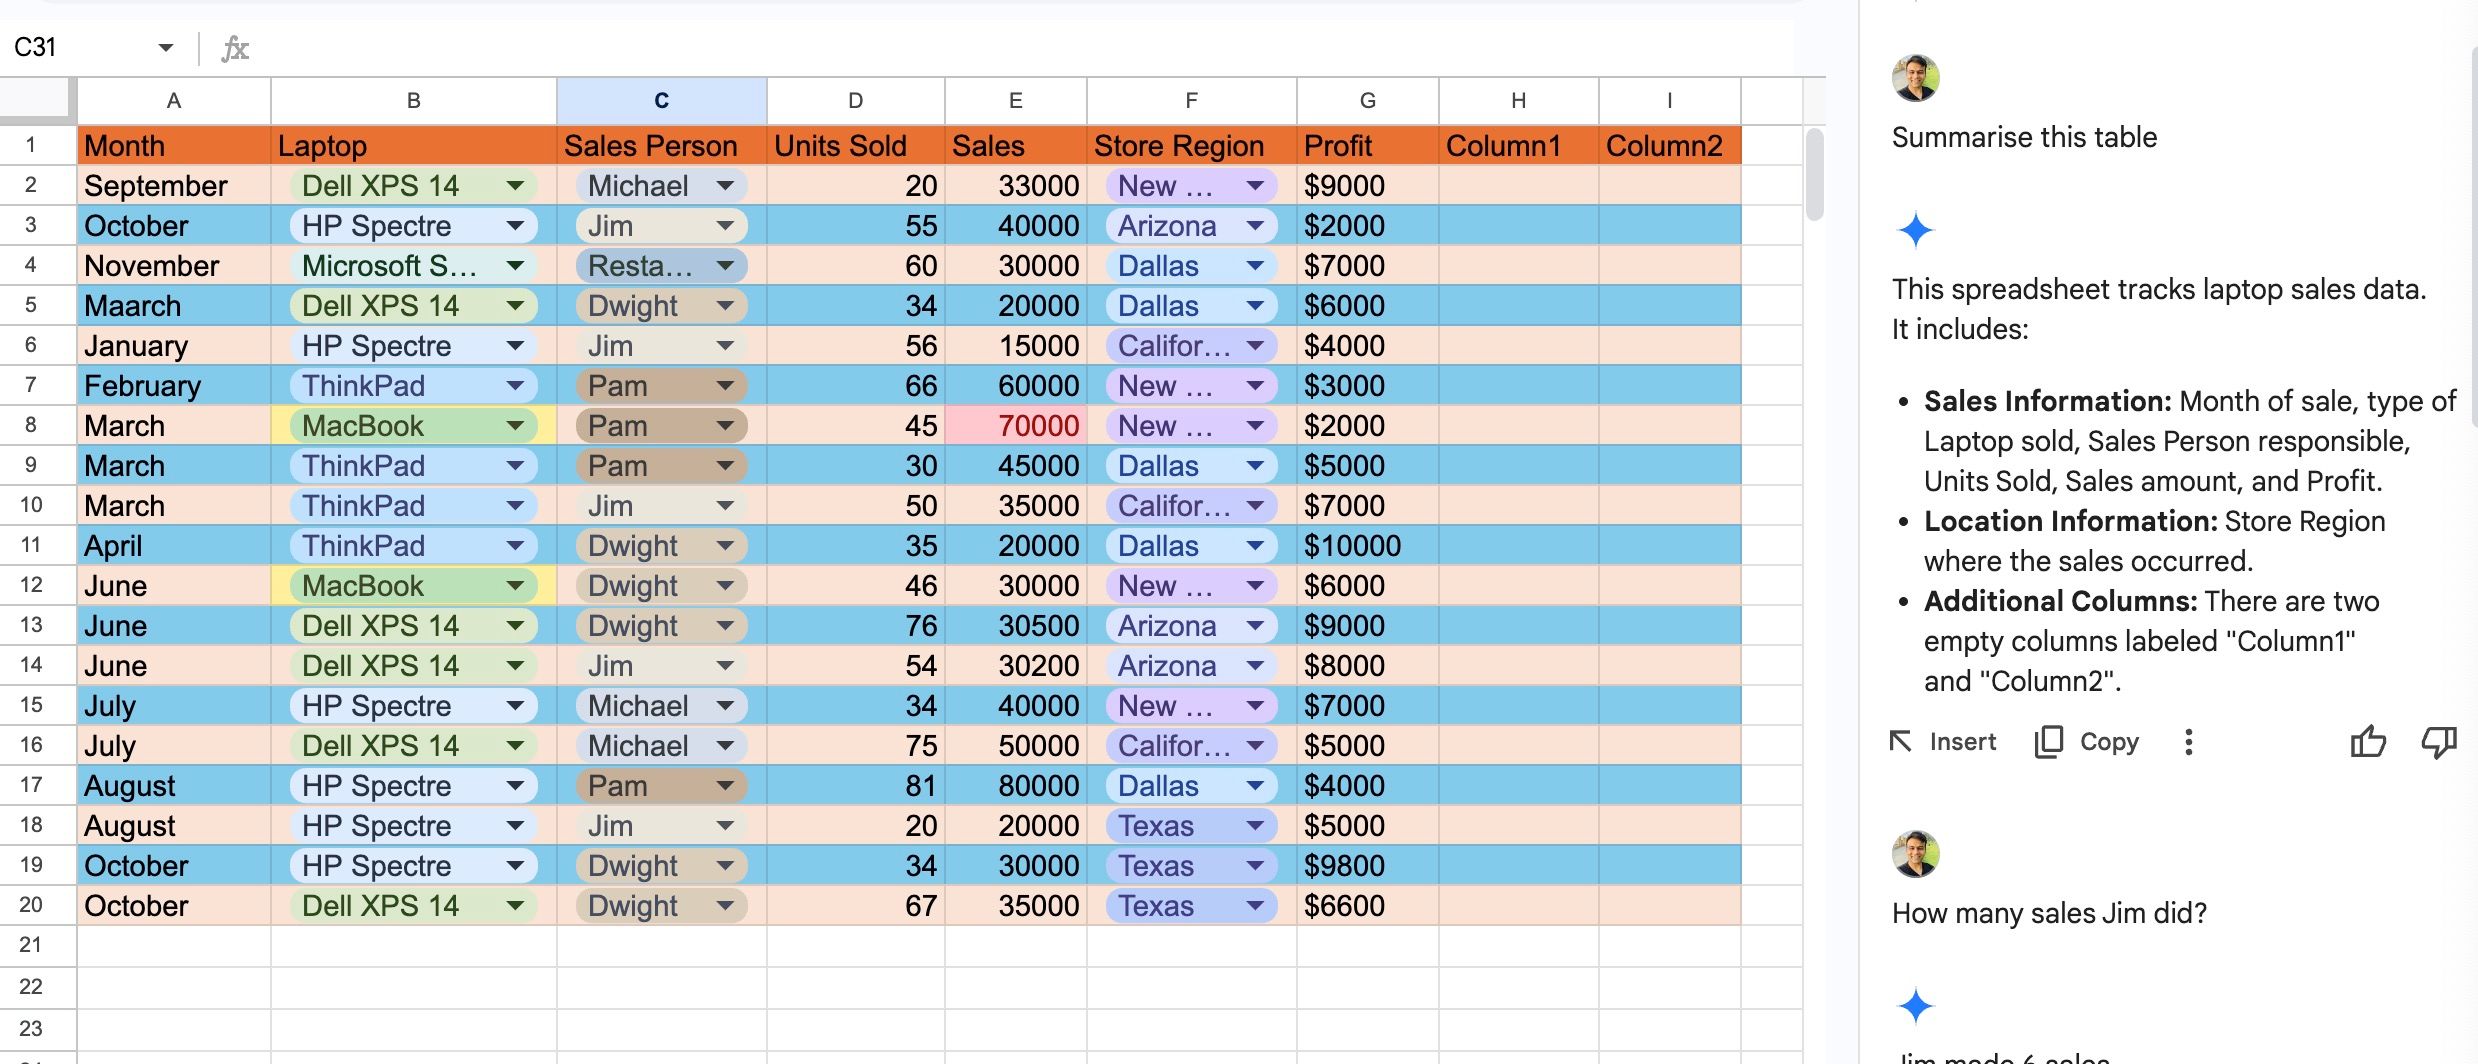
It’s a basic summary, so let’s go a step further and ask Gemini different questions about the table. I asked How much profit Jim generated? and Gemini quickly analyzed the table, calculated data from the Profit column, and gave an answer. At any point, you can select Insert and add an answer to a cell.
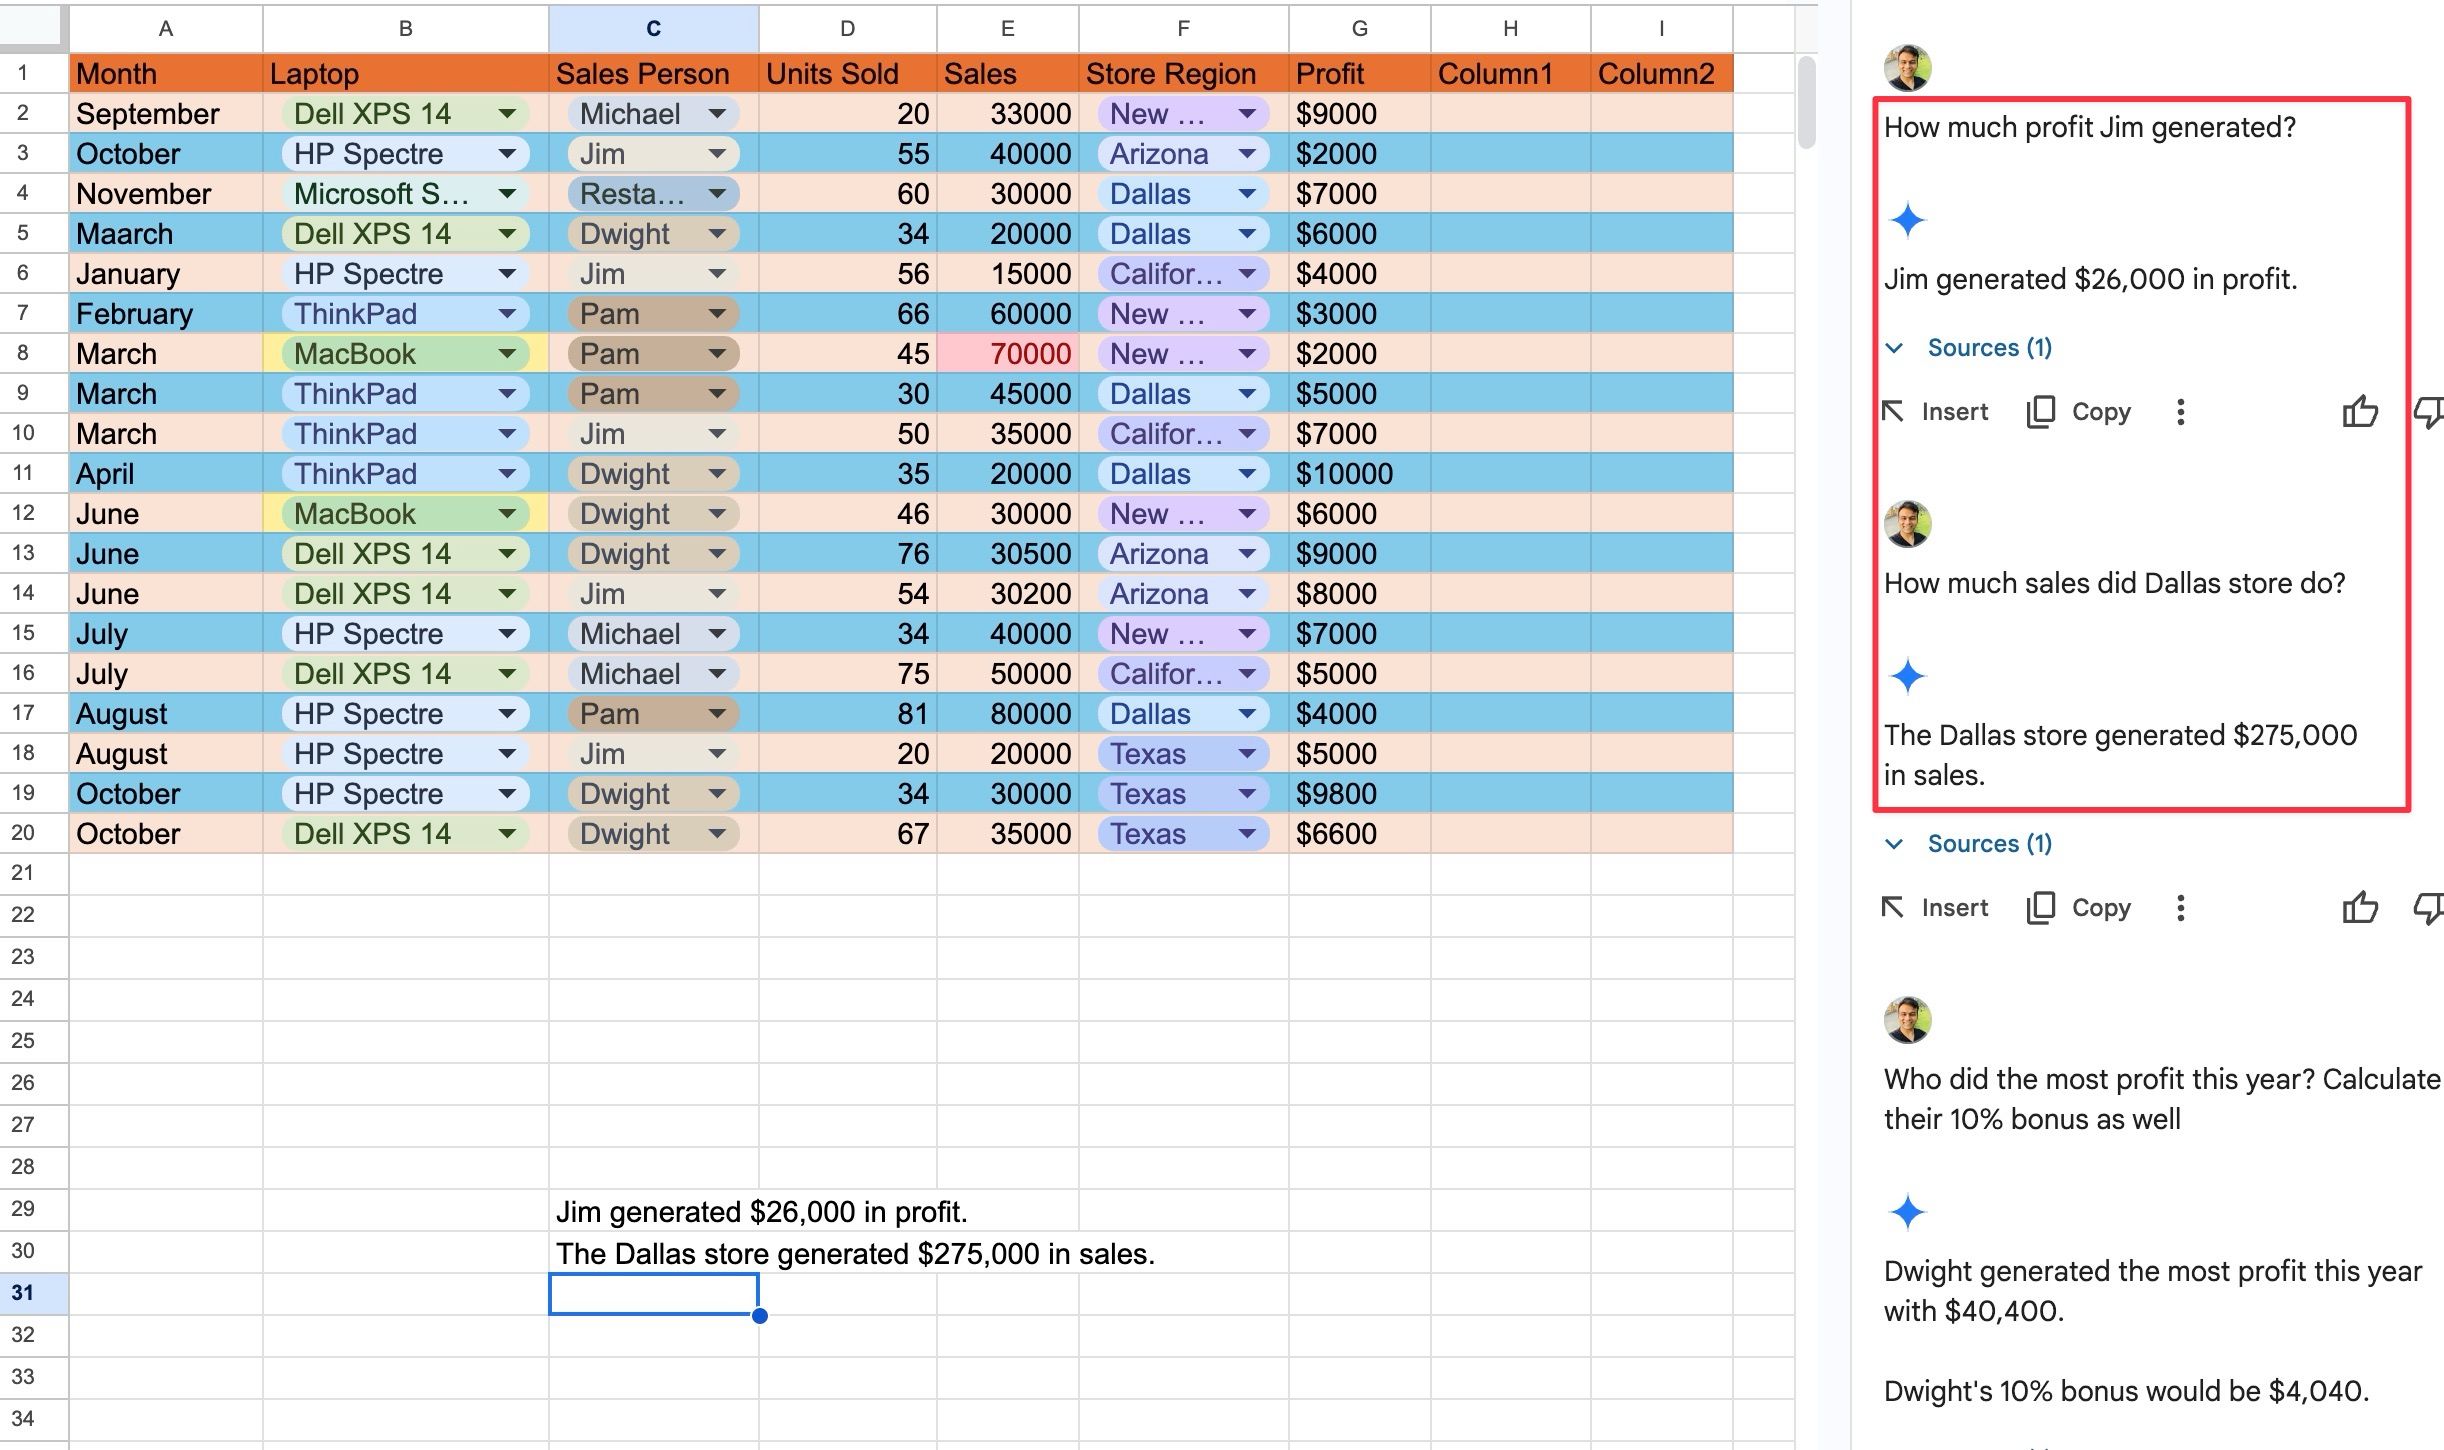
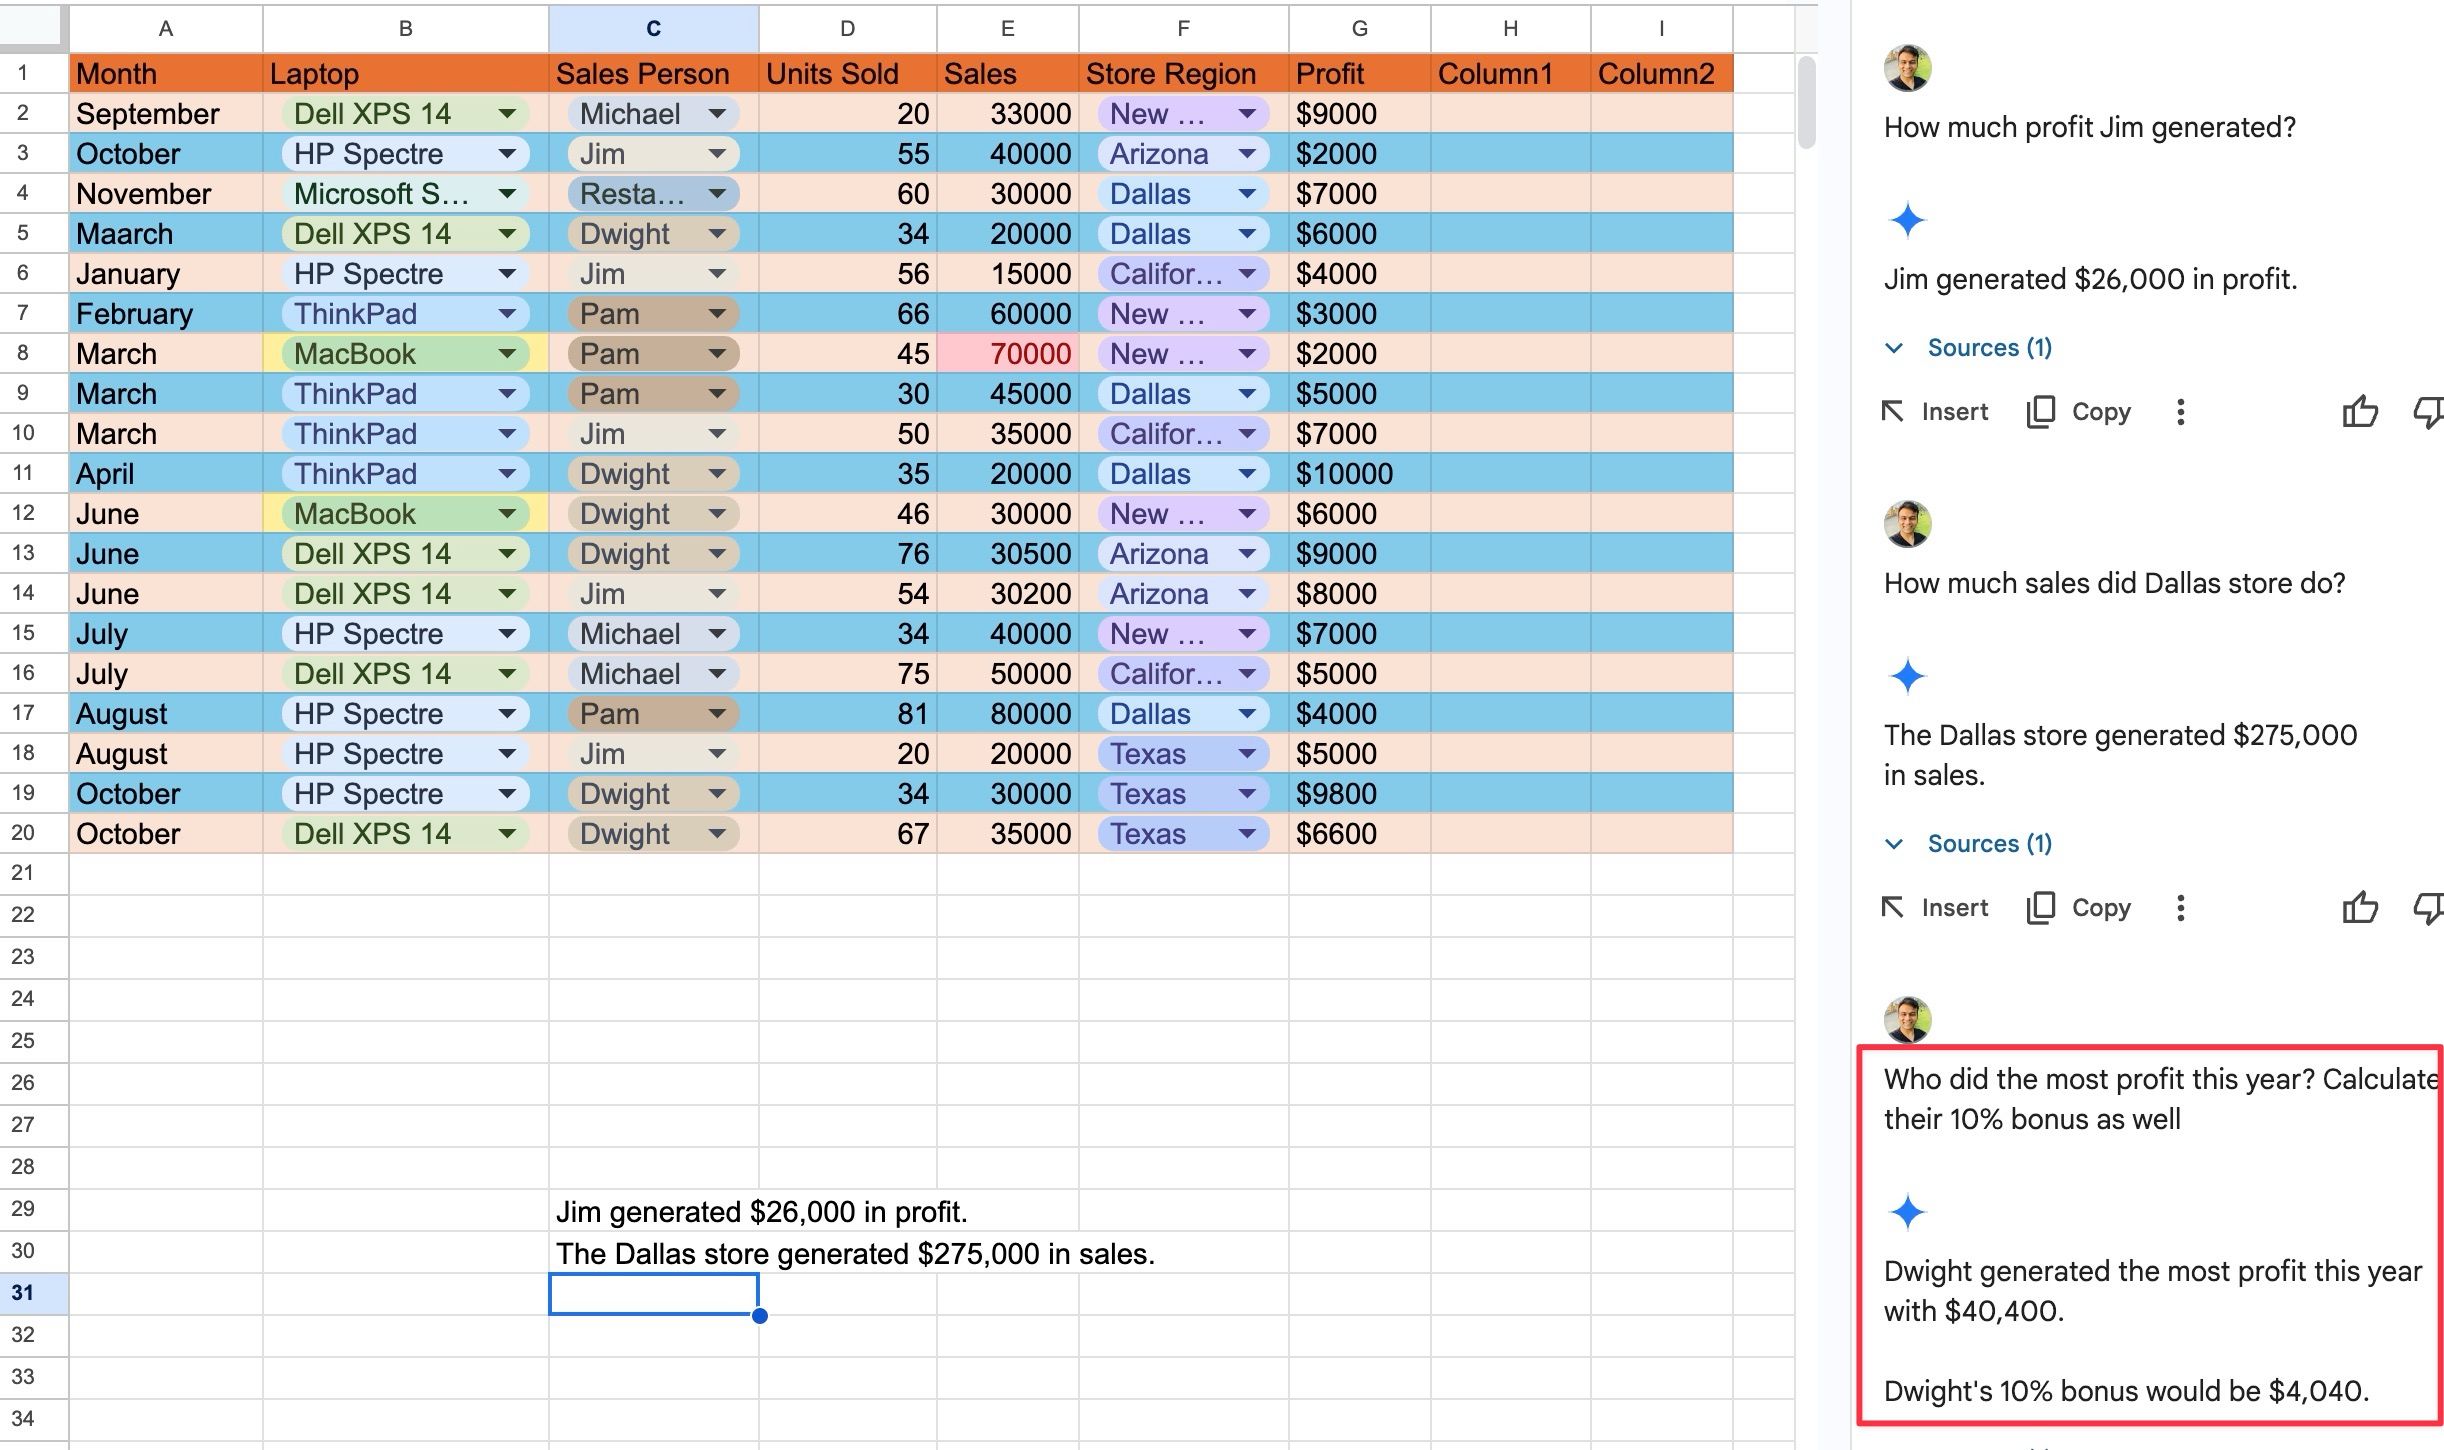
I also asked How much sales did Dallas store do? Gemini displayed a correct answer in no time. Here’s where Gemini surprised me. I asked Gemini, Who did the most profit this year? Calculate their 10% bonus as well. I received the following answer in return.
Dwight generated the most profit this year, with $40,400. Dwight’s 10% bonus would be $4,040.
Gemini eliminates the role of pivot tables. Instead of creating pivot tables to extract specific information, you can use text prompts to get the required answers from Google’s AI. This is a single example. The possibilities are endless.
4
Summarize a sales database
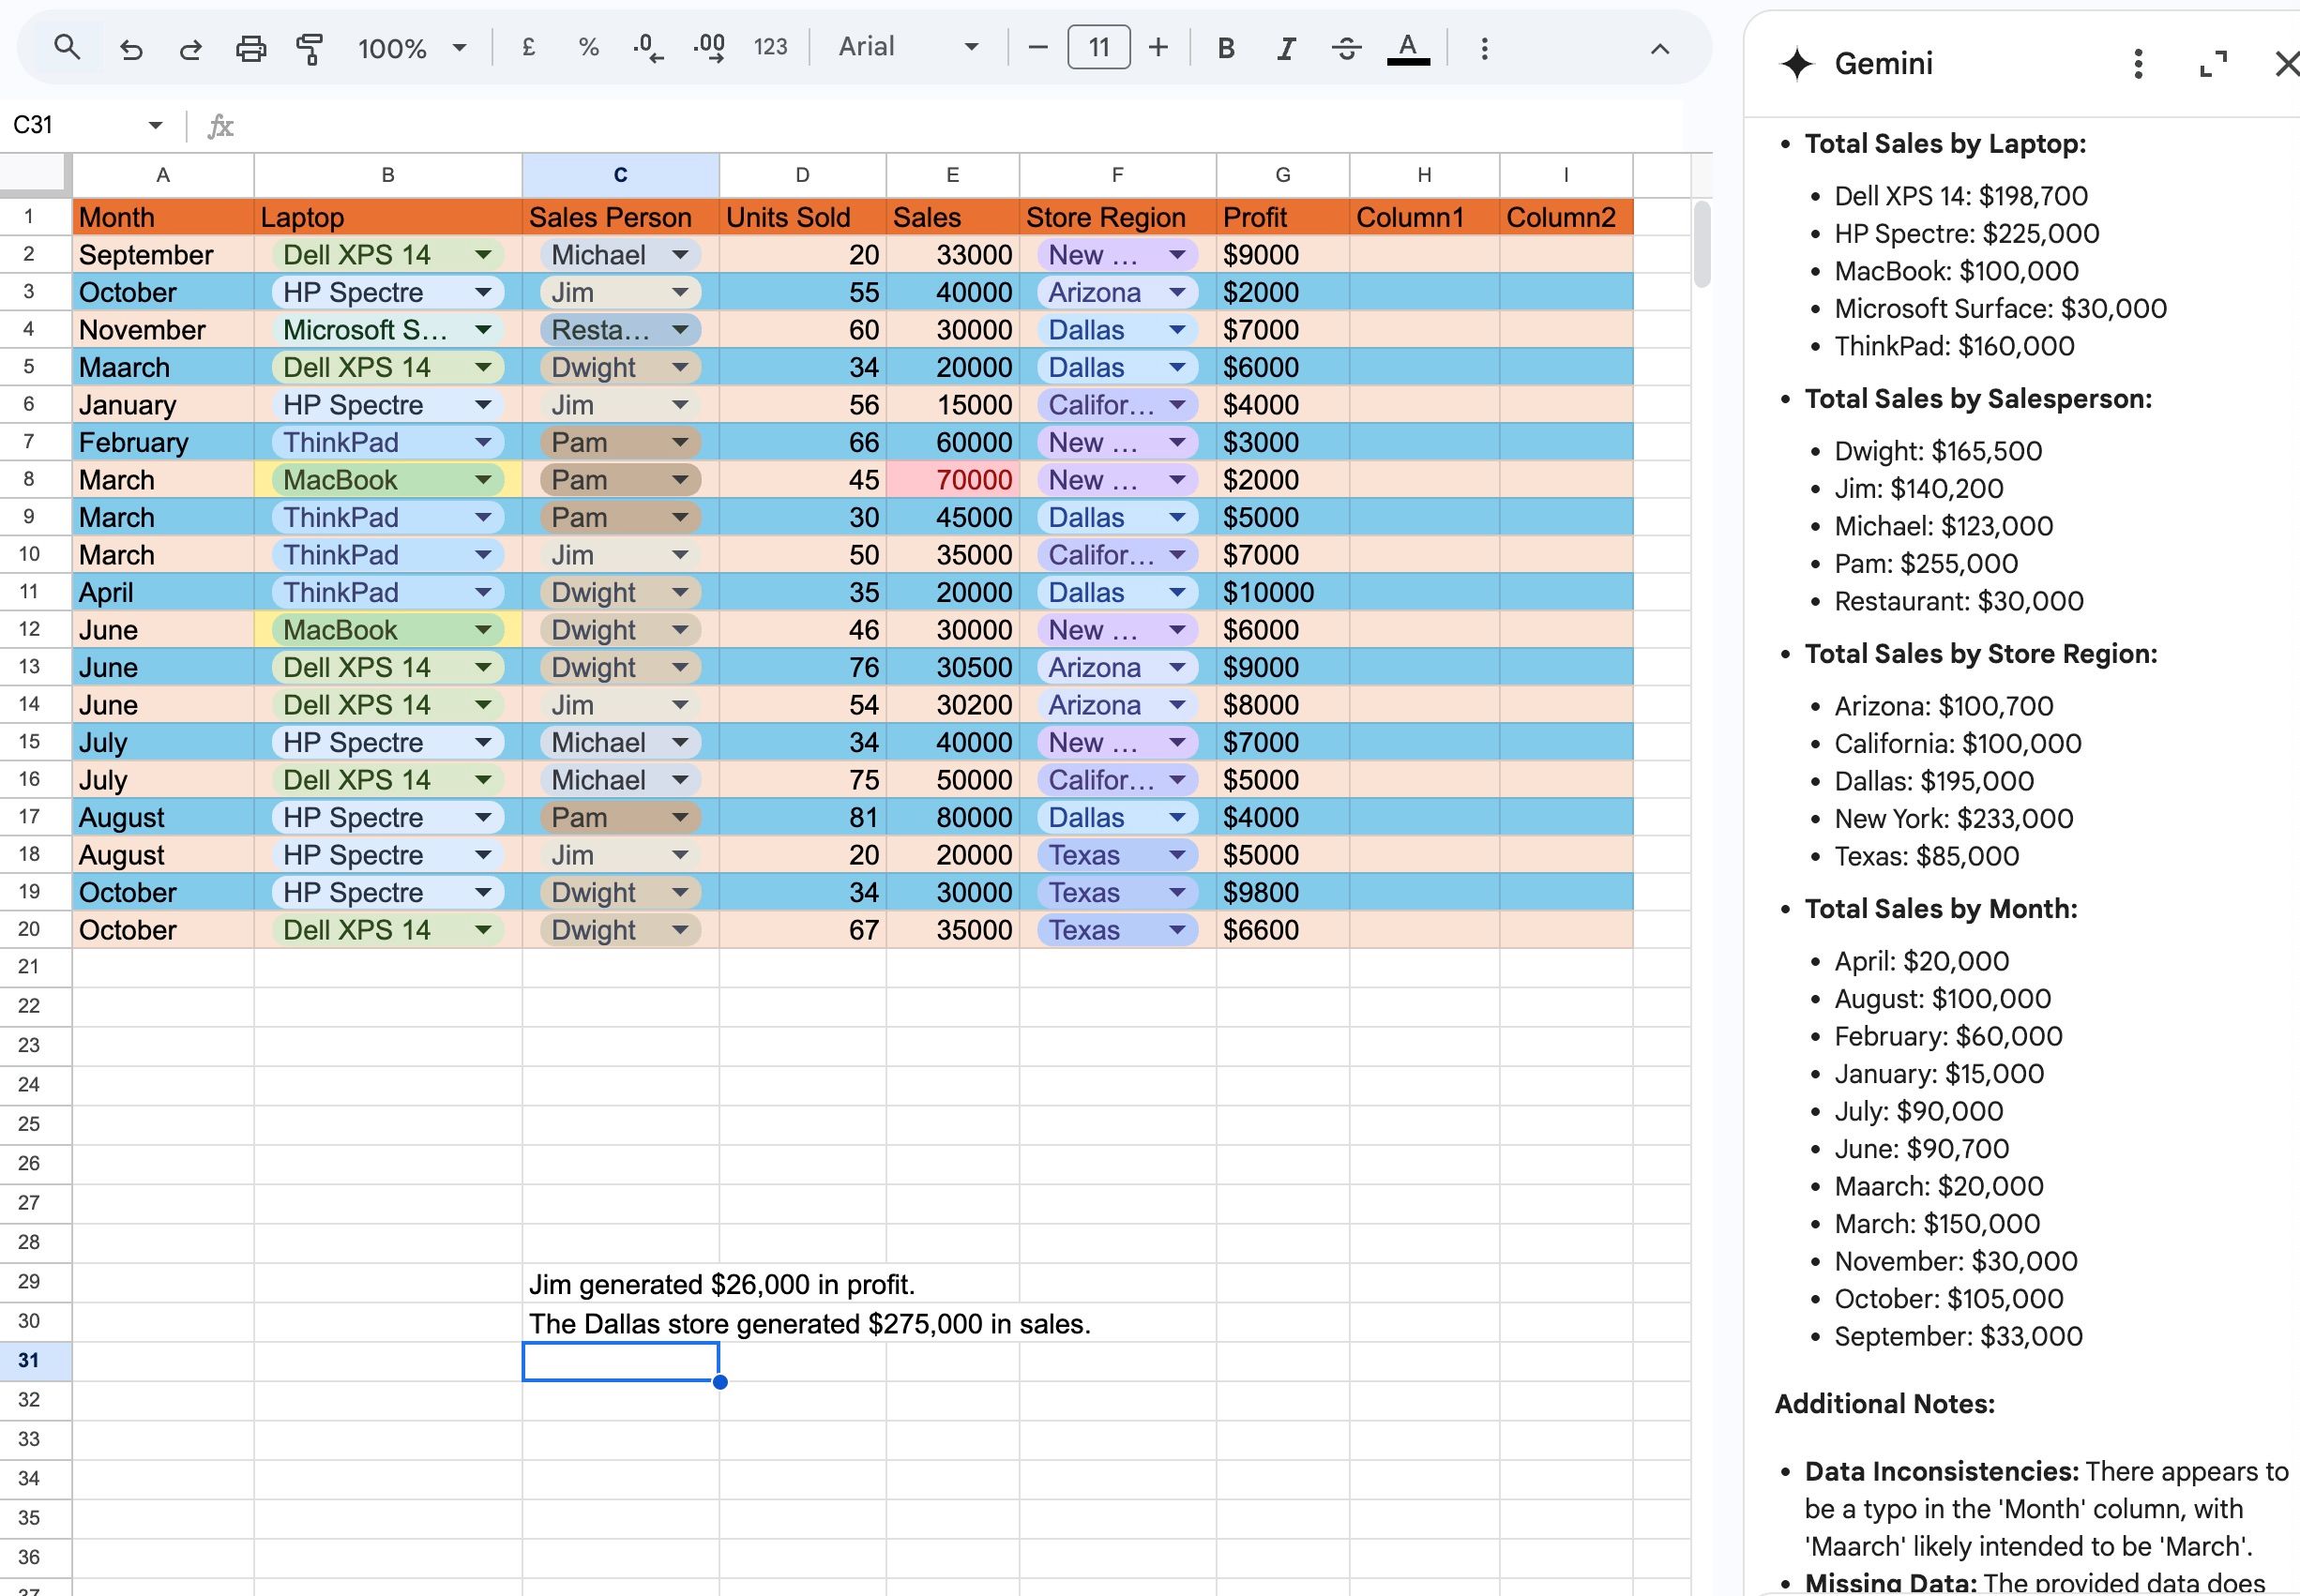
Instead of asking questions about every salesperson and region, I asked Gemini to summarize the table and give me key findings. Gemini showed total sales by laptop, salesperson, store region, and sales by month.
Gemini added additional notes and pointed out typos in the Month column and missing data like costs and expenses to complete the profit analysis. Gemini encouraged specifying the year so that it could perform year-over-year comparisons. It’s one of the things I had no idea Gemini could do.
In another example, I asked Gemini to increase next year’s sales by 20% and create a sales target table for each store region. I recommend experimenting with different text prompts to get the best out of Gemini.
3
Summarize expense reports and financial statements
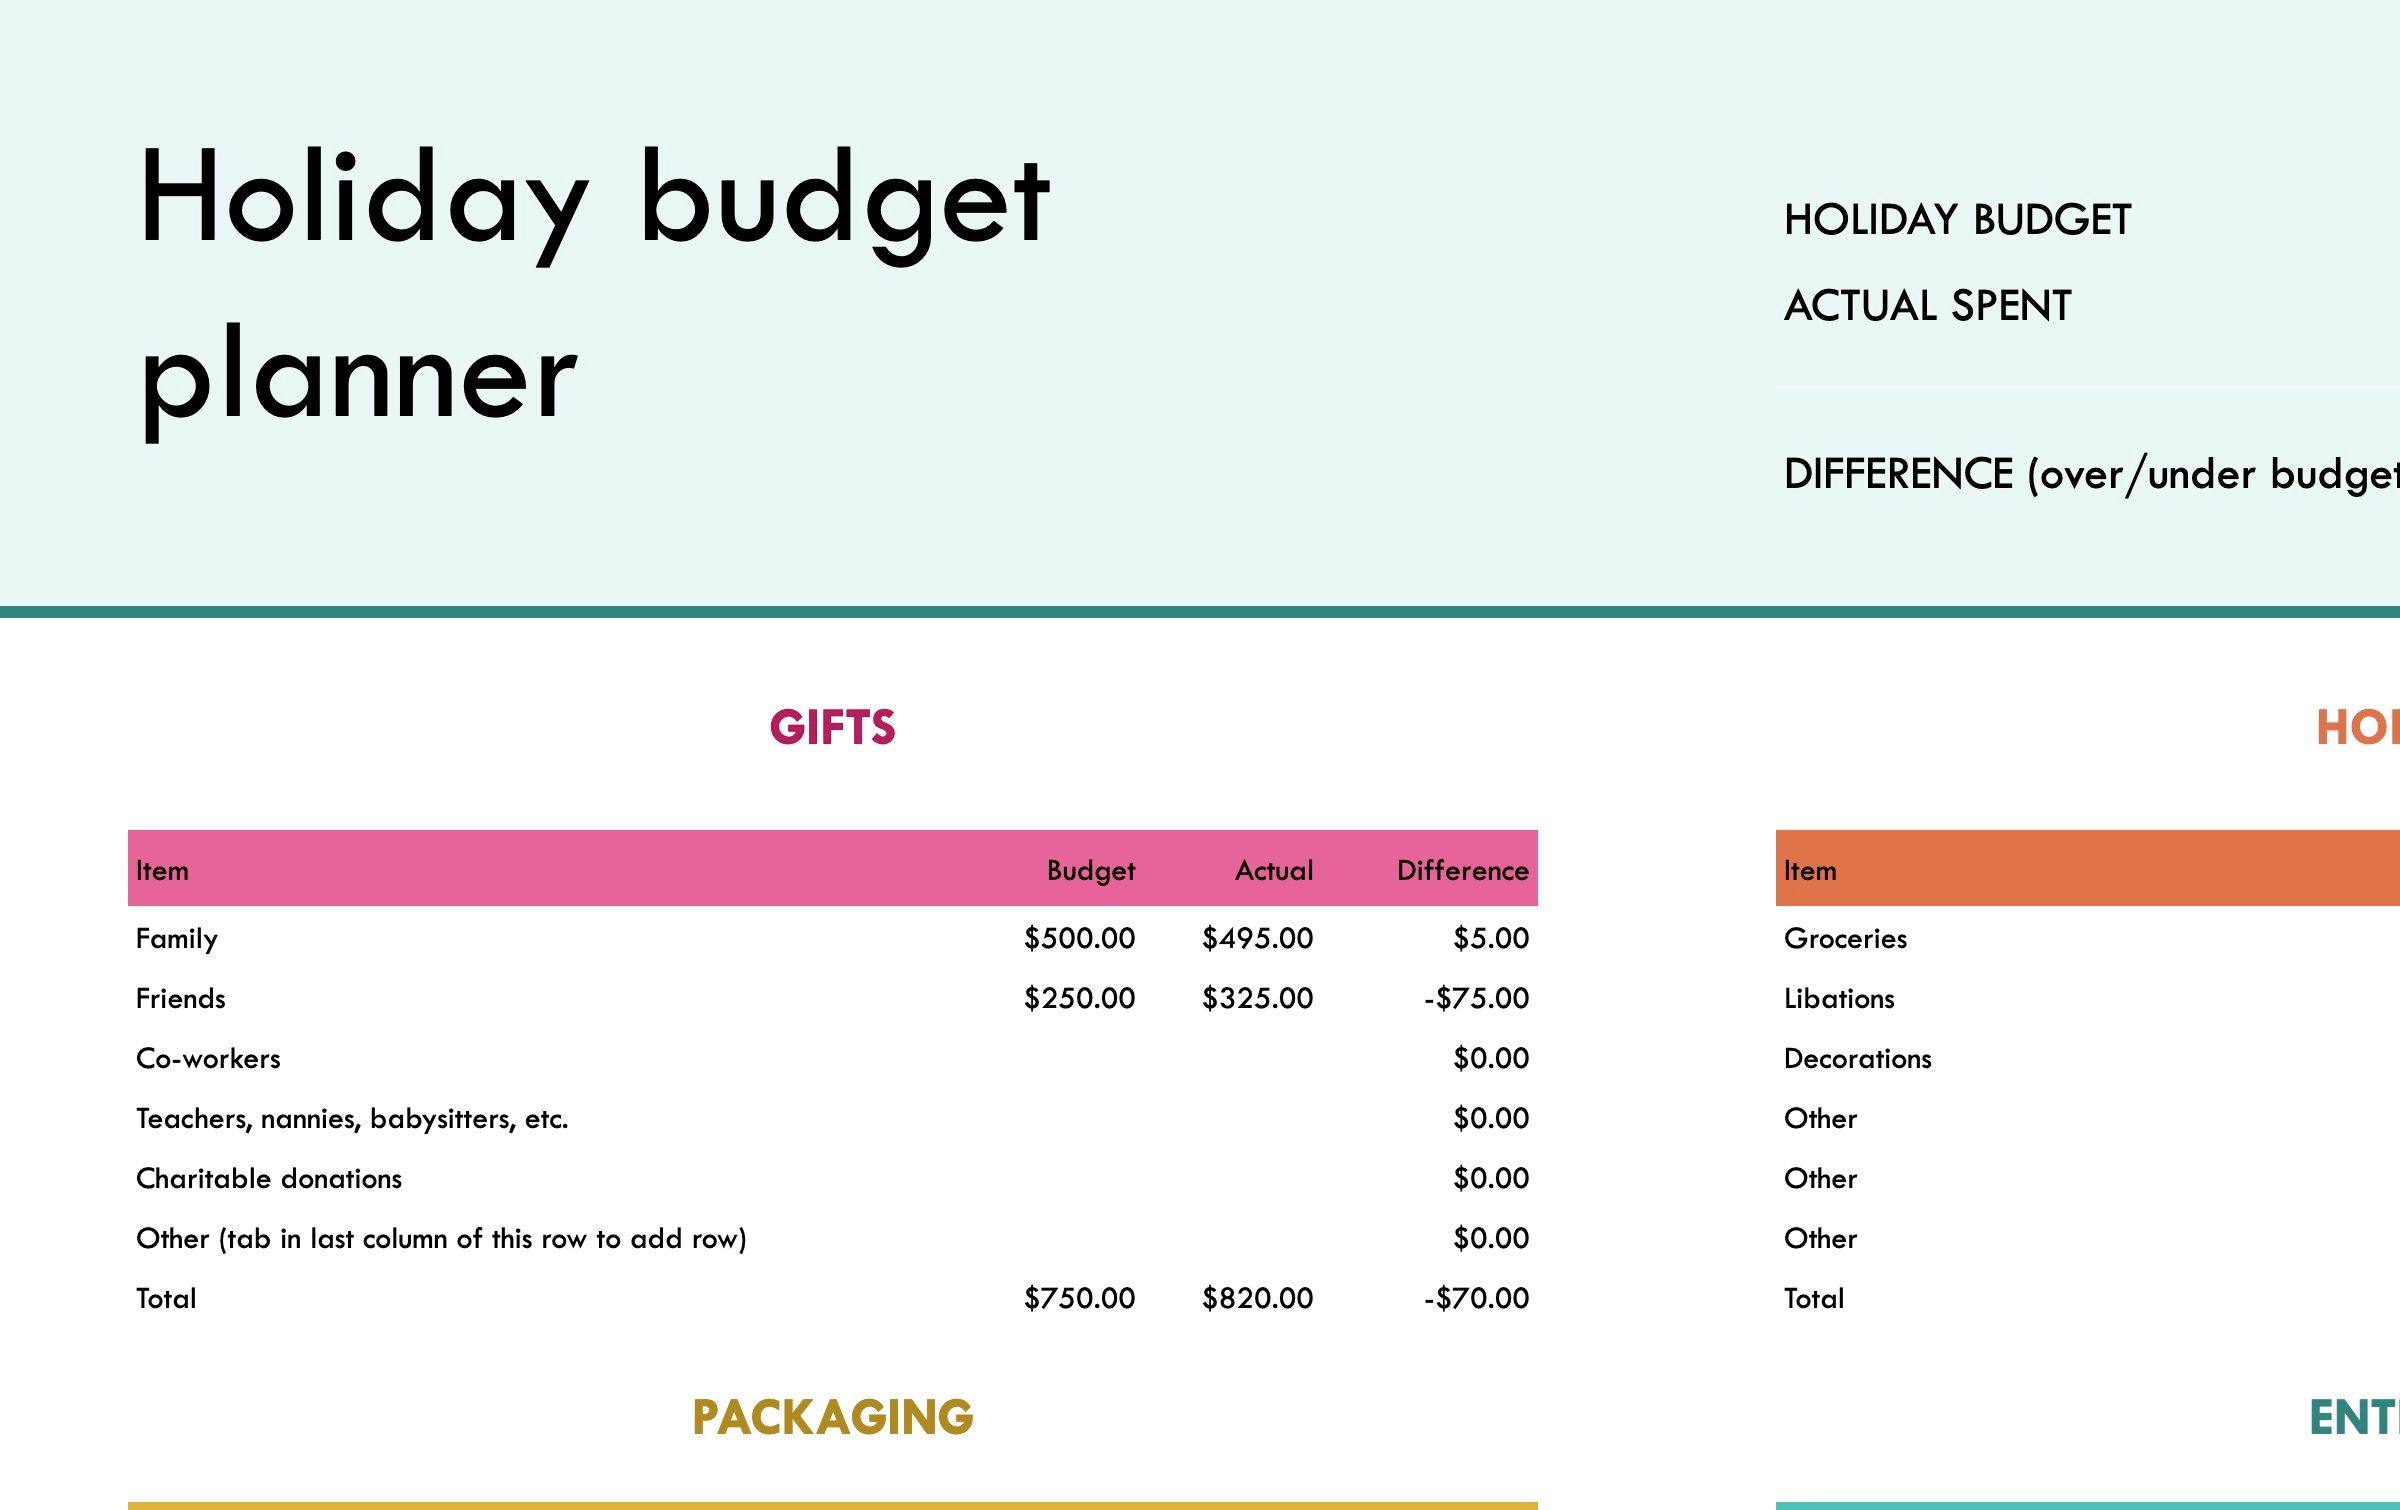
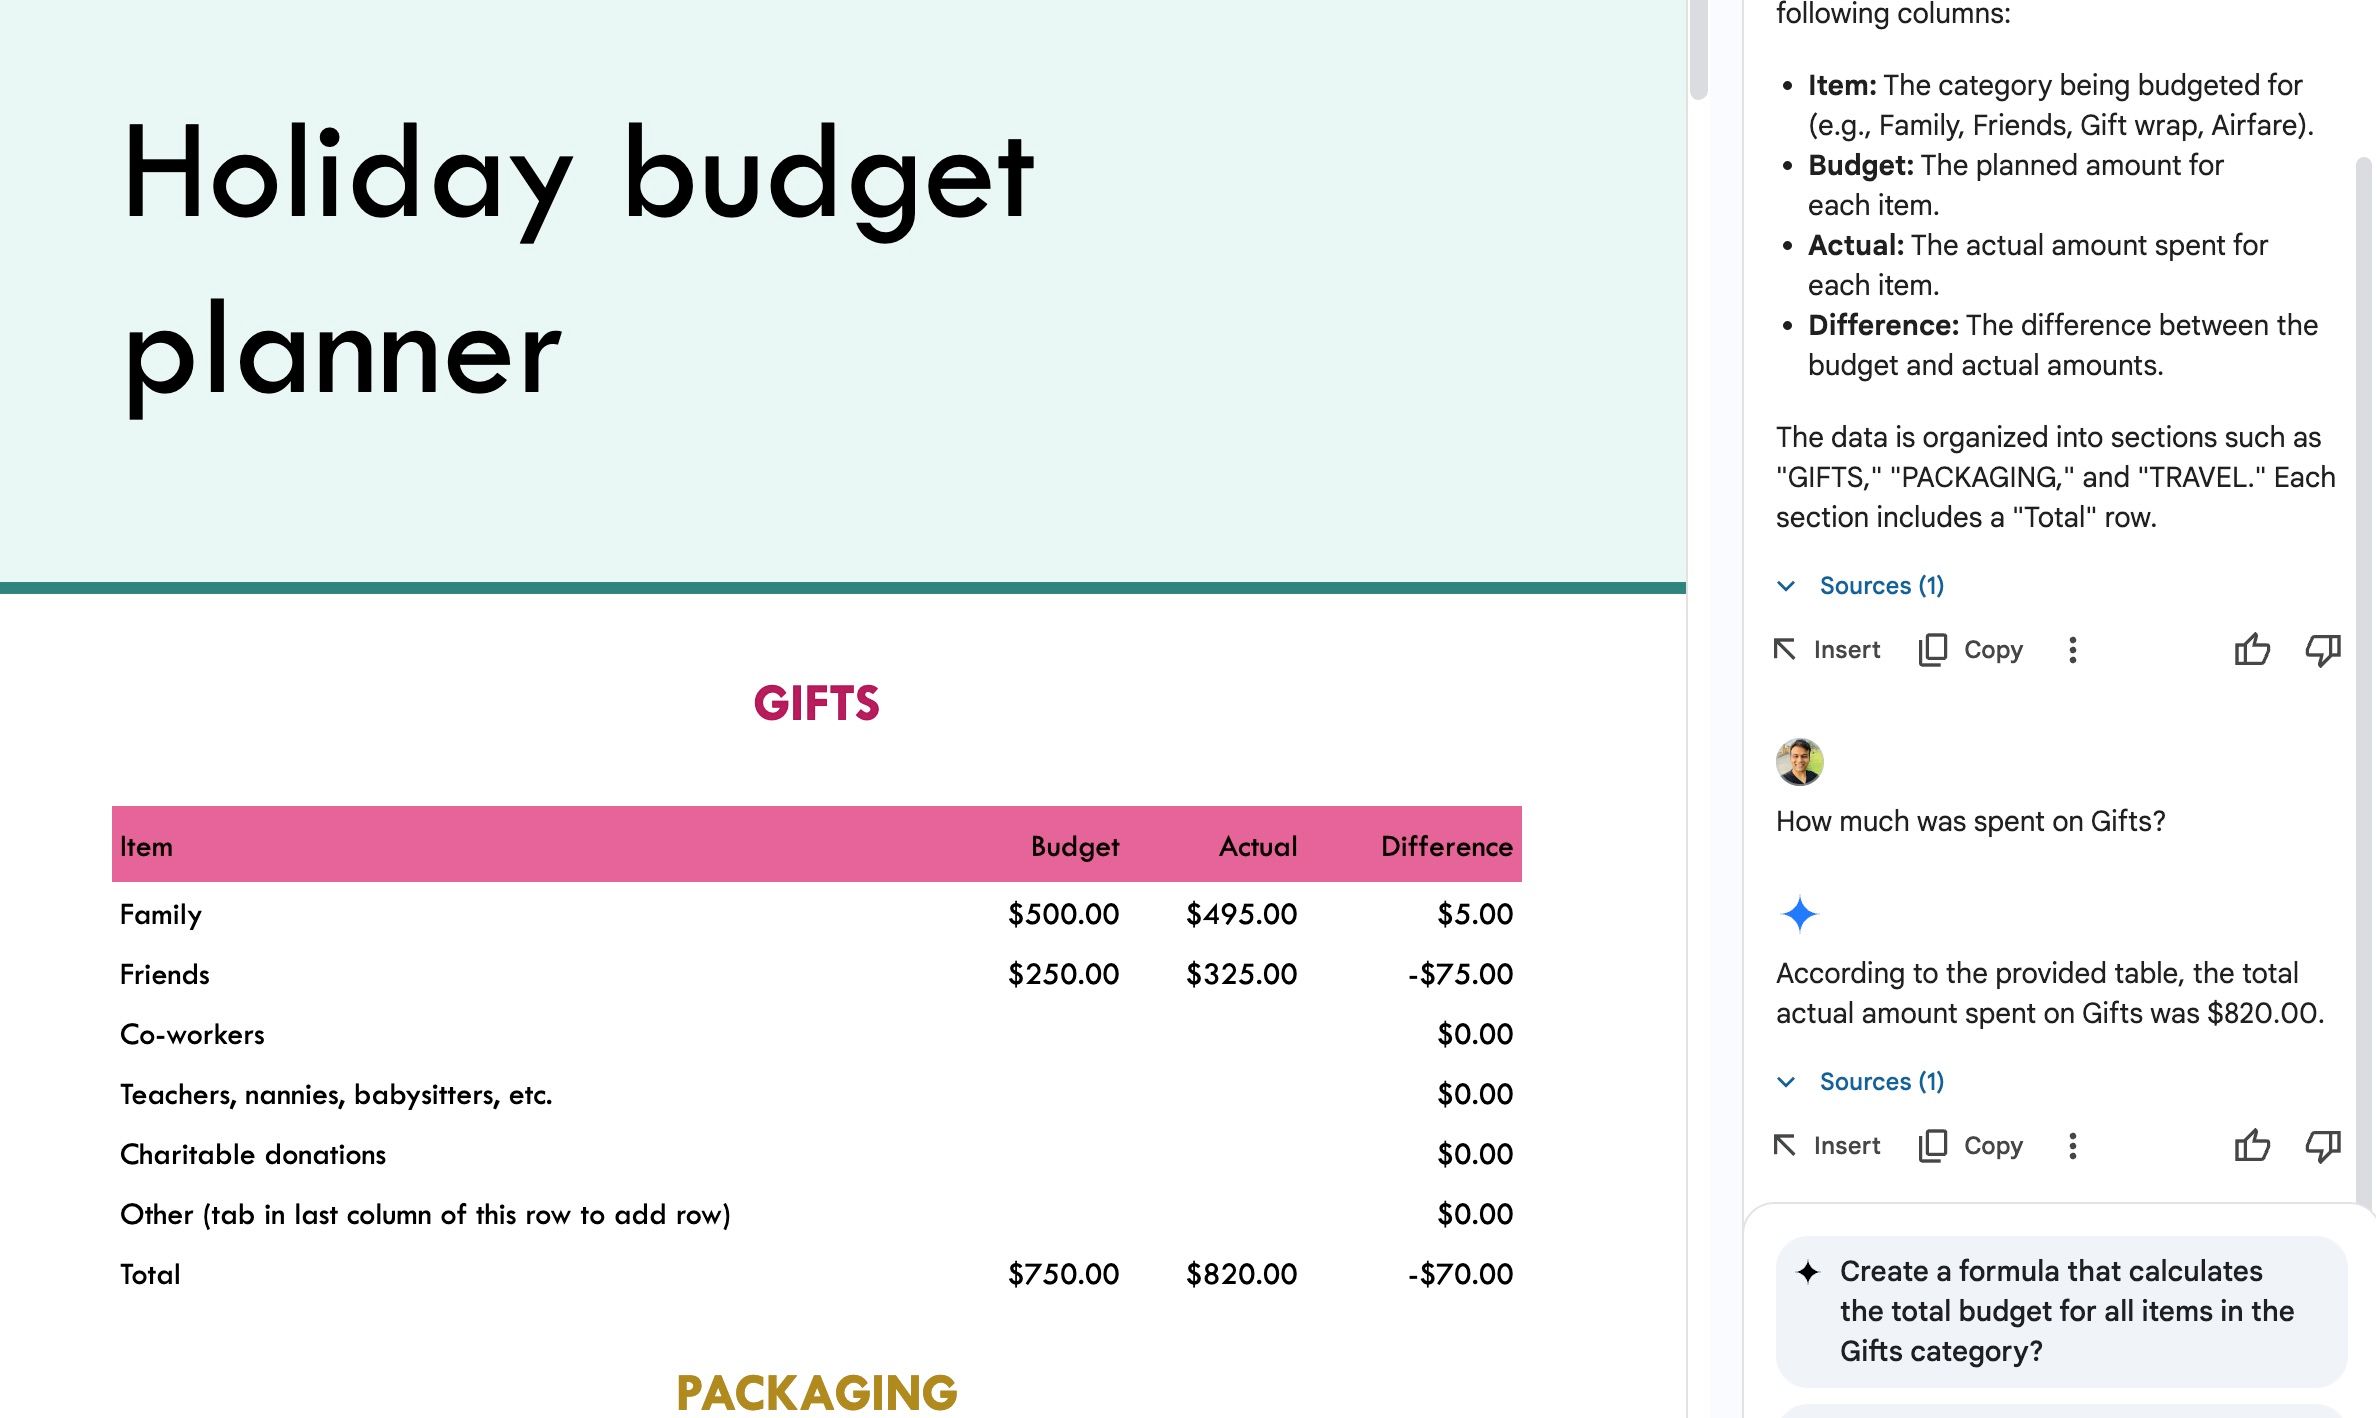
Gemini summarizes expense reports, budgets, or financial statements to identify key spending areas or revenue streams. It also generates summaries of investment portfolios to track performance. Suppose you created a holiday budget planner with expense categories like Travel, Gifts, Food and Dining, Activities and Entertainment, Decorations, budgeted amounts, actual amounts, variances, payment methods, and more.
When your spreadsheet is ready, use Gemini to summarize the spreadsheet using the prompts below:
- Summarize the total budgeted expenses.
- Give me the total actual expenses.
- Provide a summary of the variances between budgeted and actual costs.
- Summarize spending by category.
- Summarize spending by payment method.
Similarly, you can perform trend and comparative analysis and get answers to specific questions:
- Which expense categories exceeded the budget most significantly?
- Which days had the highest spending?
- Compare the budgeted amounts to the actual amounts for each category.
- Compare spending across different payment methods.
- How much was spent on travel?
- What was the total spent on gifts?
You can quickly and easily extract valuable financial insights from your holiday budget planner and make decisions accordingly.
2
Get data insights from customer survey responses
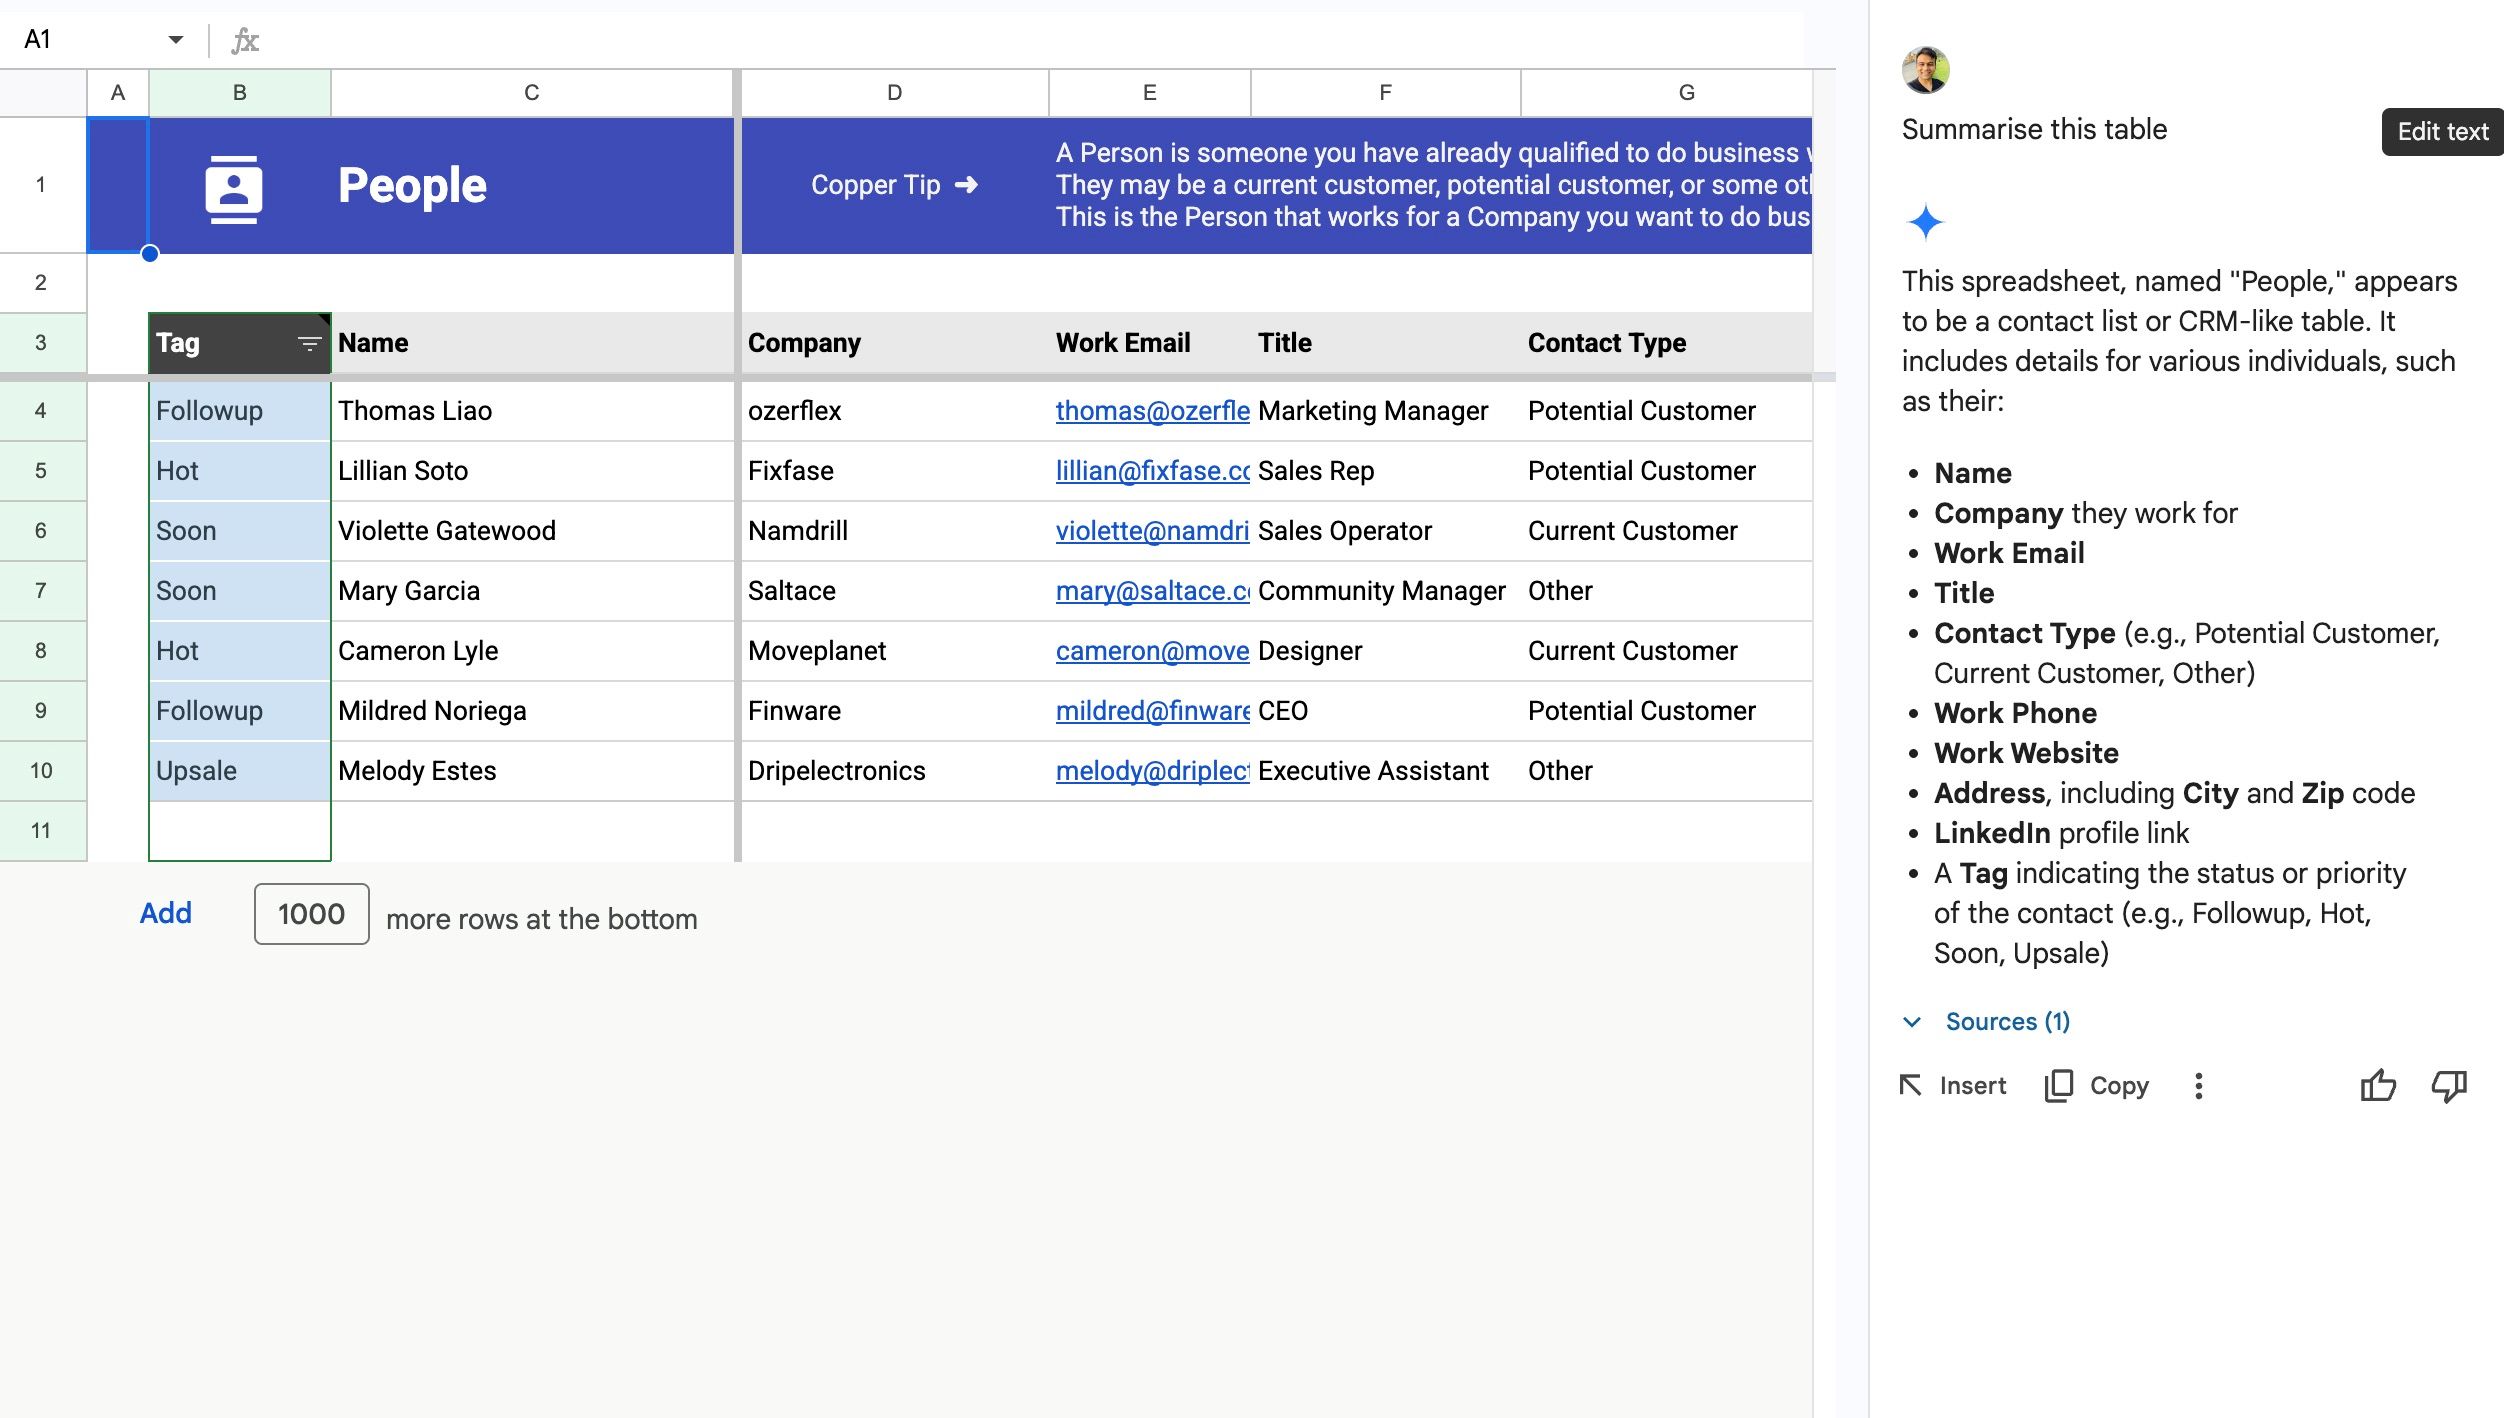
Whether dealing with survey responses, customer reviews, support tickets, social media mentions, or email feedback, you can use Gemini to extract data and get insights. Gemini analyzes text data to determine the sentiment (positive, negative, or neutral) of customer feedback.
Gemini summarizes large volumes of text feedback and provides astute overviews of key findings. This is useful for long reviews or large collections of comments. Here are some of the prompts you can run on your spreadsheet:
- Analyze the customer reviews in this sheet and tell me the overall sentiment.
- What are the top three recurring complaints regarding support tickets?
- Summarize the key themes from this set of customer survey responses.
Businesses can transform raw customer feedback into valuable insights and improve their products, services, and customer experiences.

Related
I created an entire presentation using Gemini in Google Slides, here is how it went
From idea to finished presentation
1
Summarize project timelines
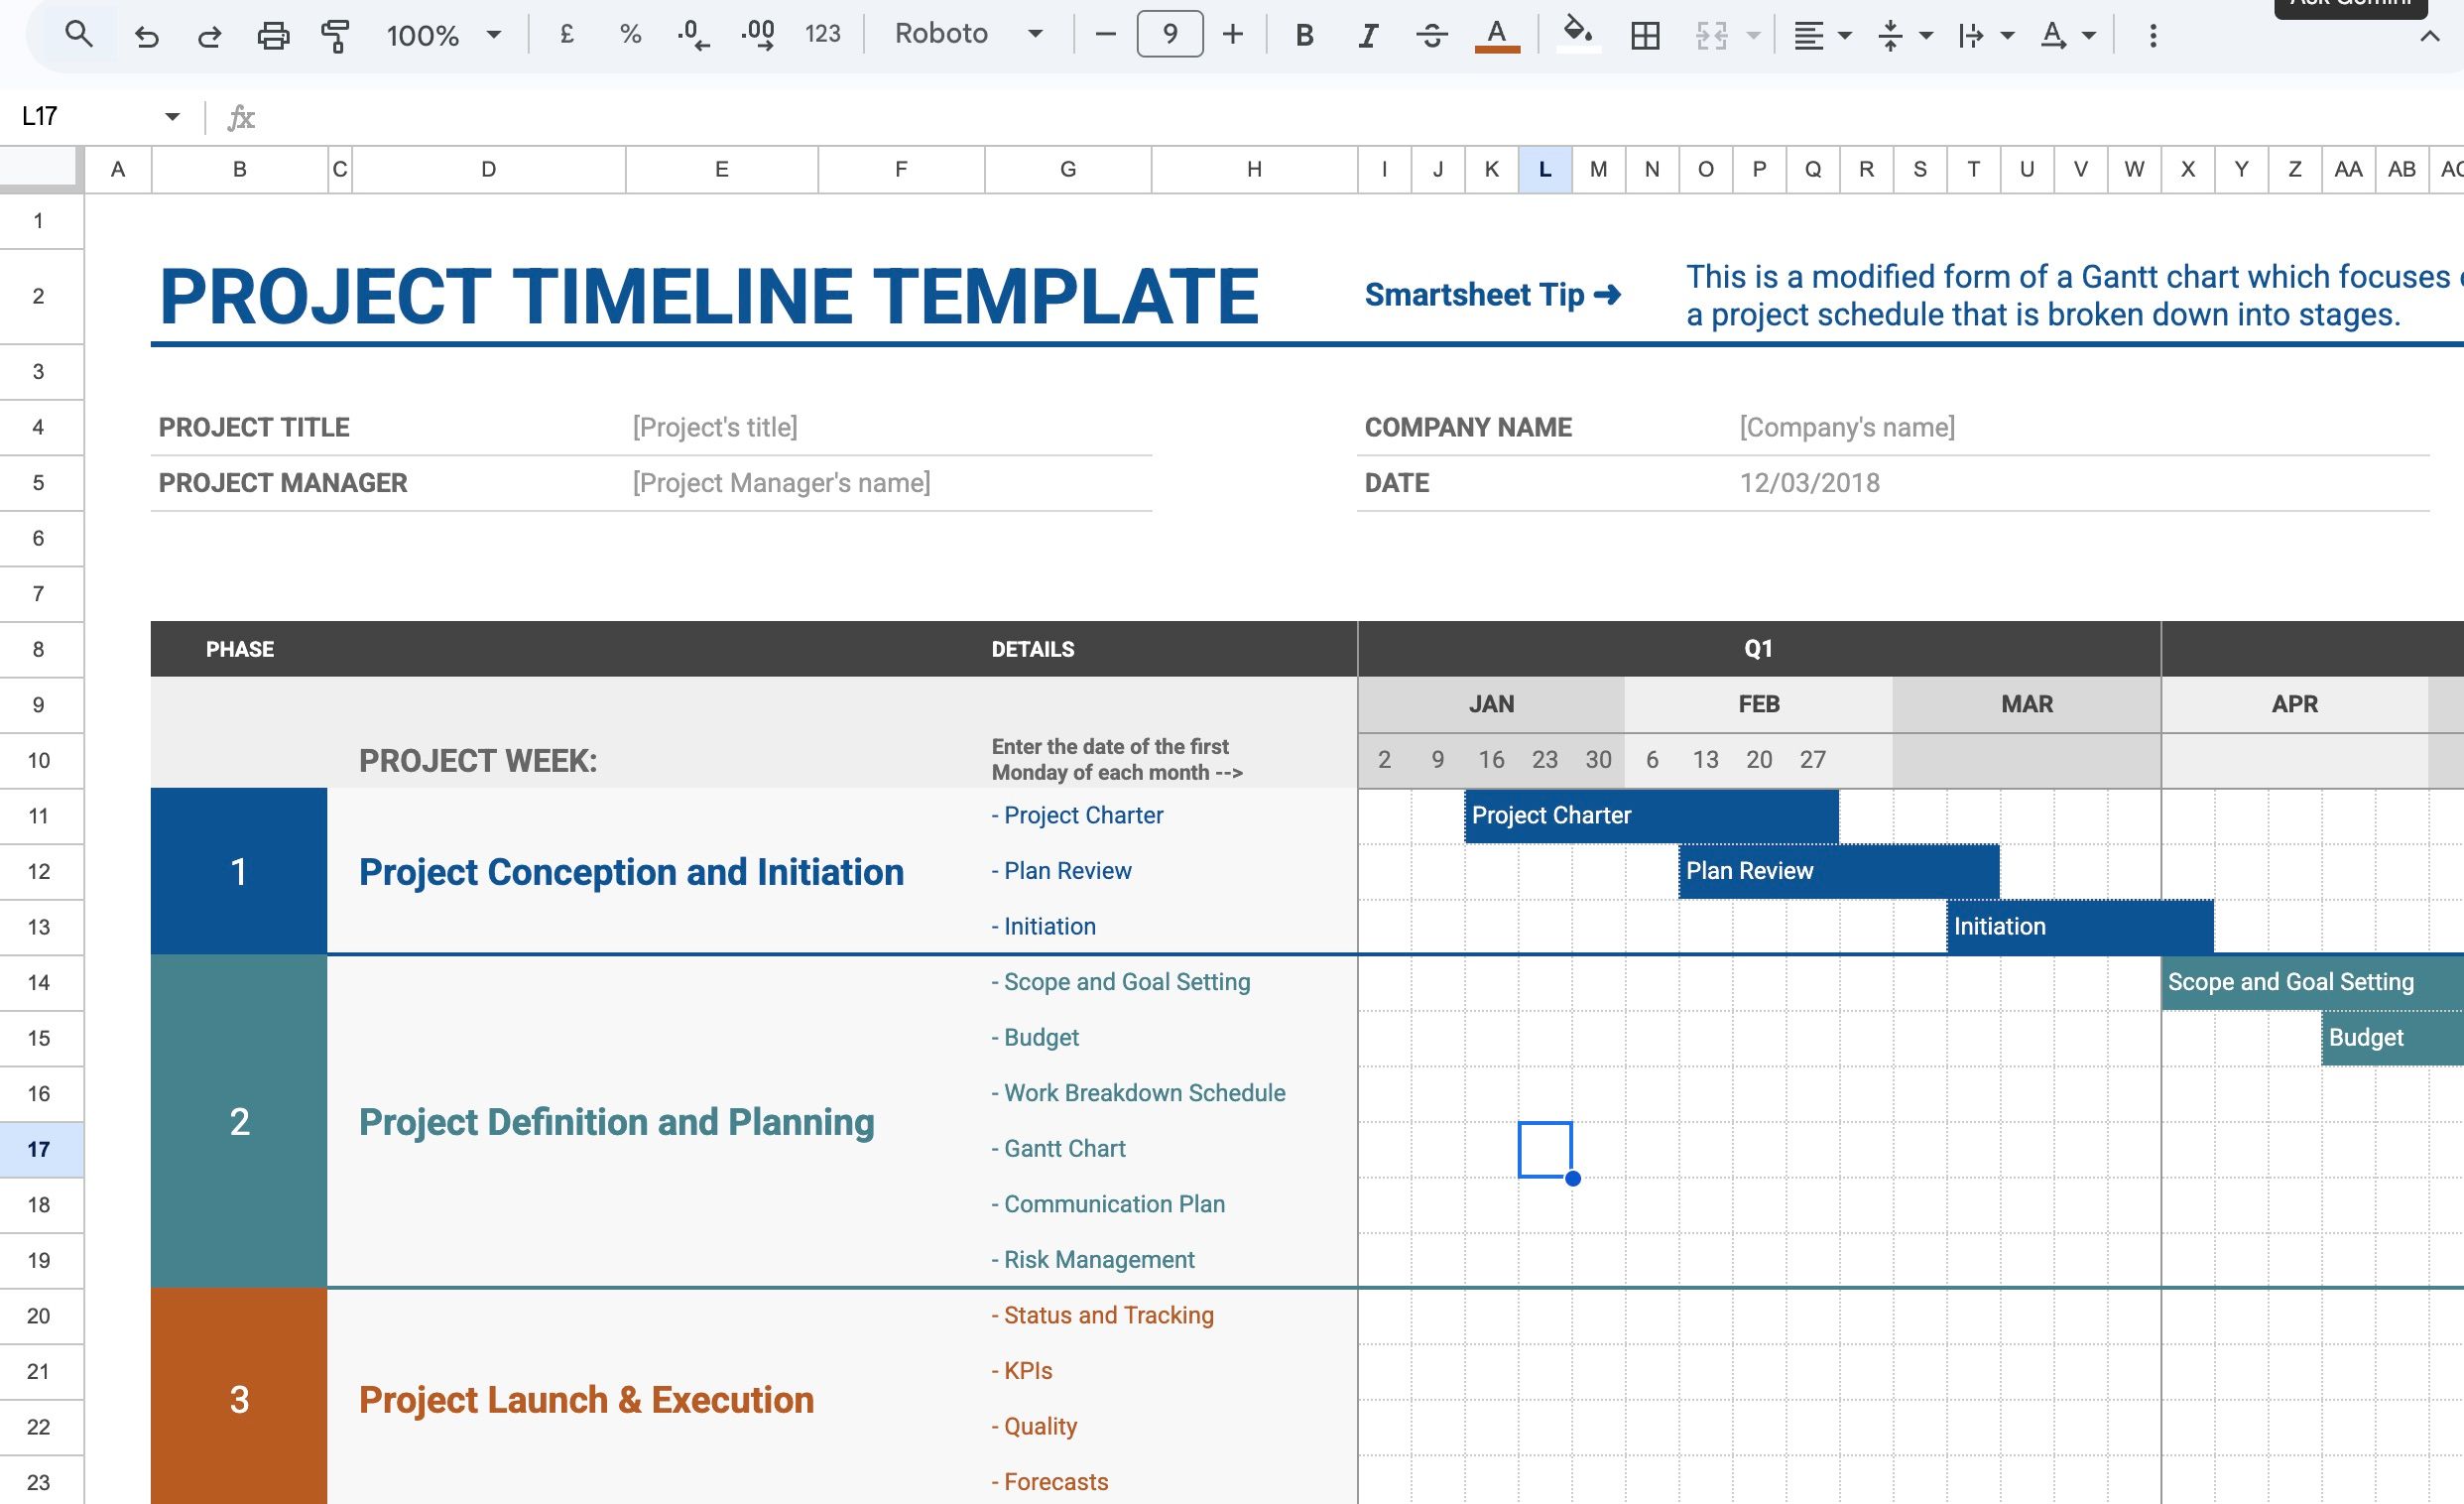
Although Google Sheets isn’t a dedicated project management tool, many still use it for its familiar interface, customization capabilities, and seamless collaboration. If you are among them, use Gemini to create project summaries, forecast, manage tasks, and more. Here are some prompts you can run to simplify your project management:
- Summarize the project’s current progress.
- Give me a summary of tasks that are behind schedule.
- Summarize the project budget and highlight overspending.
- Identify tasks that are significantly behind schedule.
- Flag unexpected budget overruns.
- Show me the tasks currently blocking the completion of the Phase 2 milestone.
Gemini quickly summarizes progress, spots problems, and predicts deadlines, helping project managers stay organized and make better decisions.
Supercharge your spreadsheets
Gemini in Google Sheets fundamentally shifts how we interact with data. By identifying patterns, generating summaries, and predicting trends, Gemini turns Google Sheets into a powerful analytical tool. What are you waiting for? Sign up for a free one-month trial, take Gemini up for a spin, and get ready to make informed, data-driven decisions.
Google Sheets goes beyond data analysis. Here are the unique ways to use Google’s spreadsheet tool beyond number crunching.