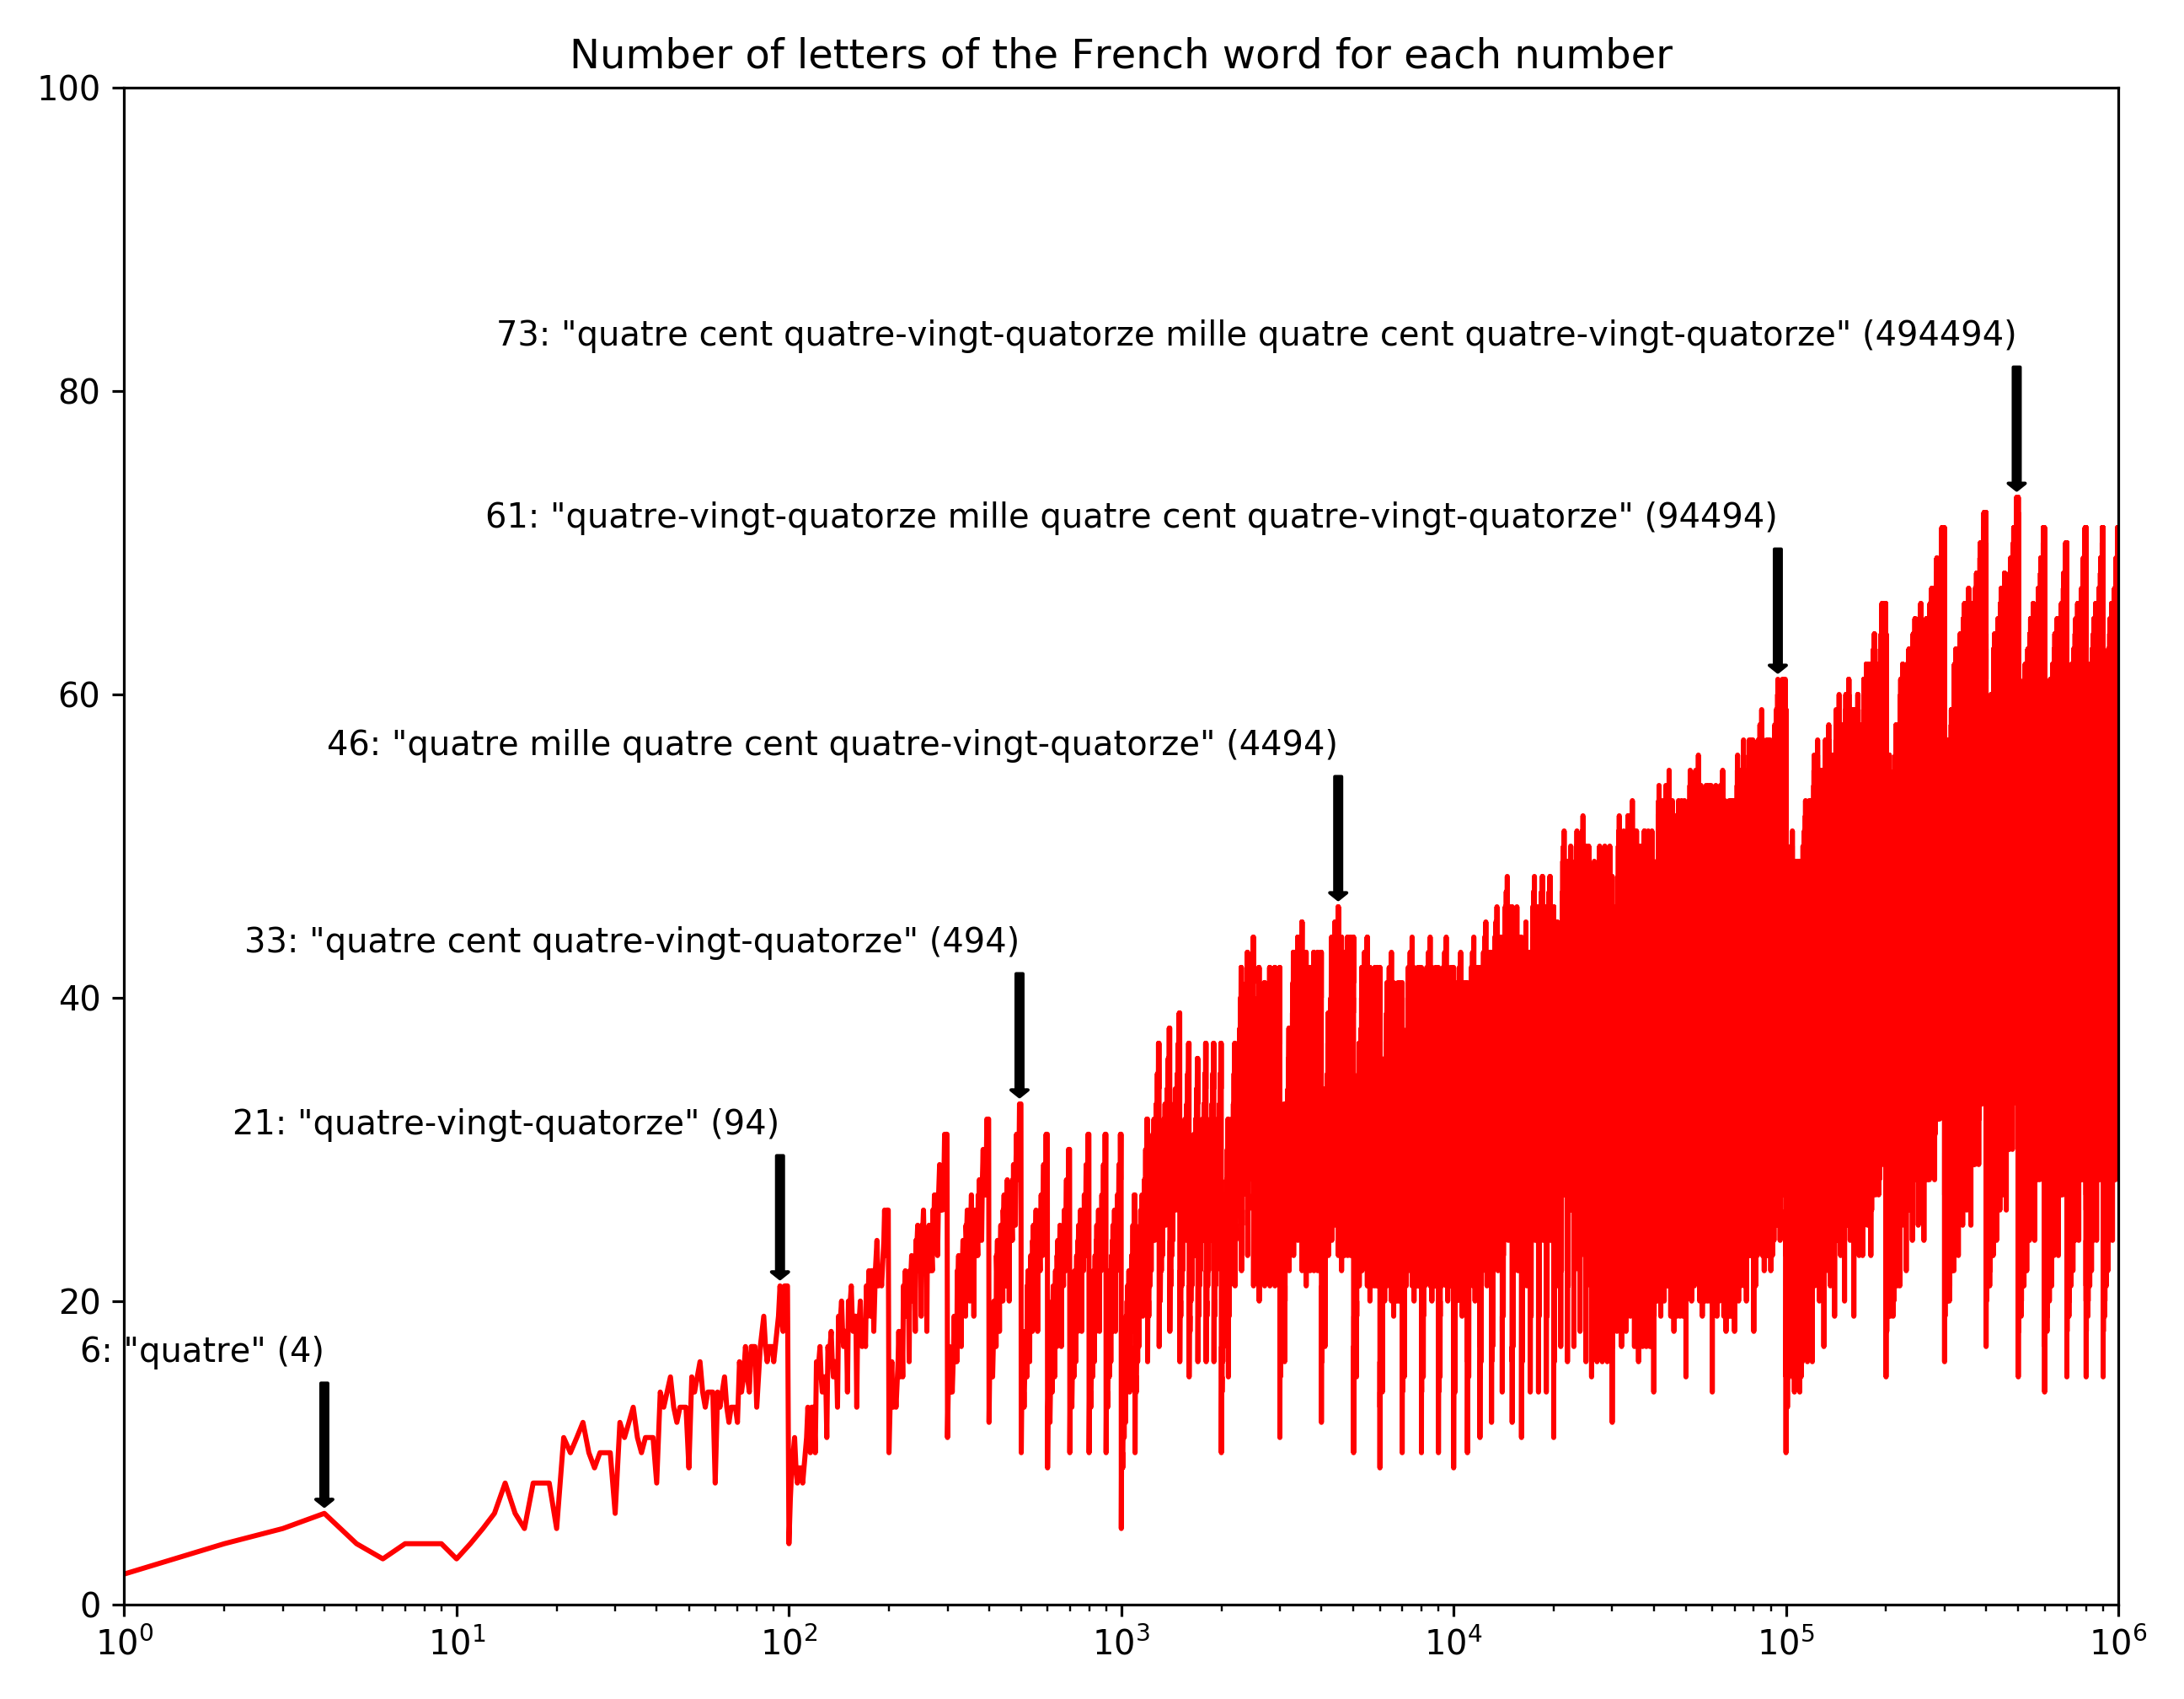
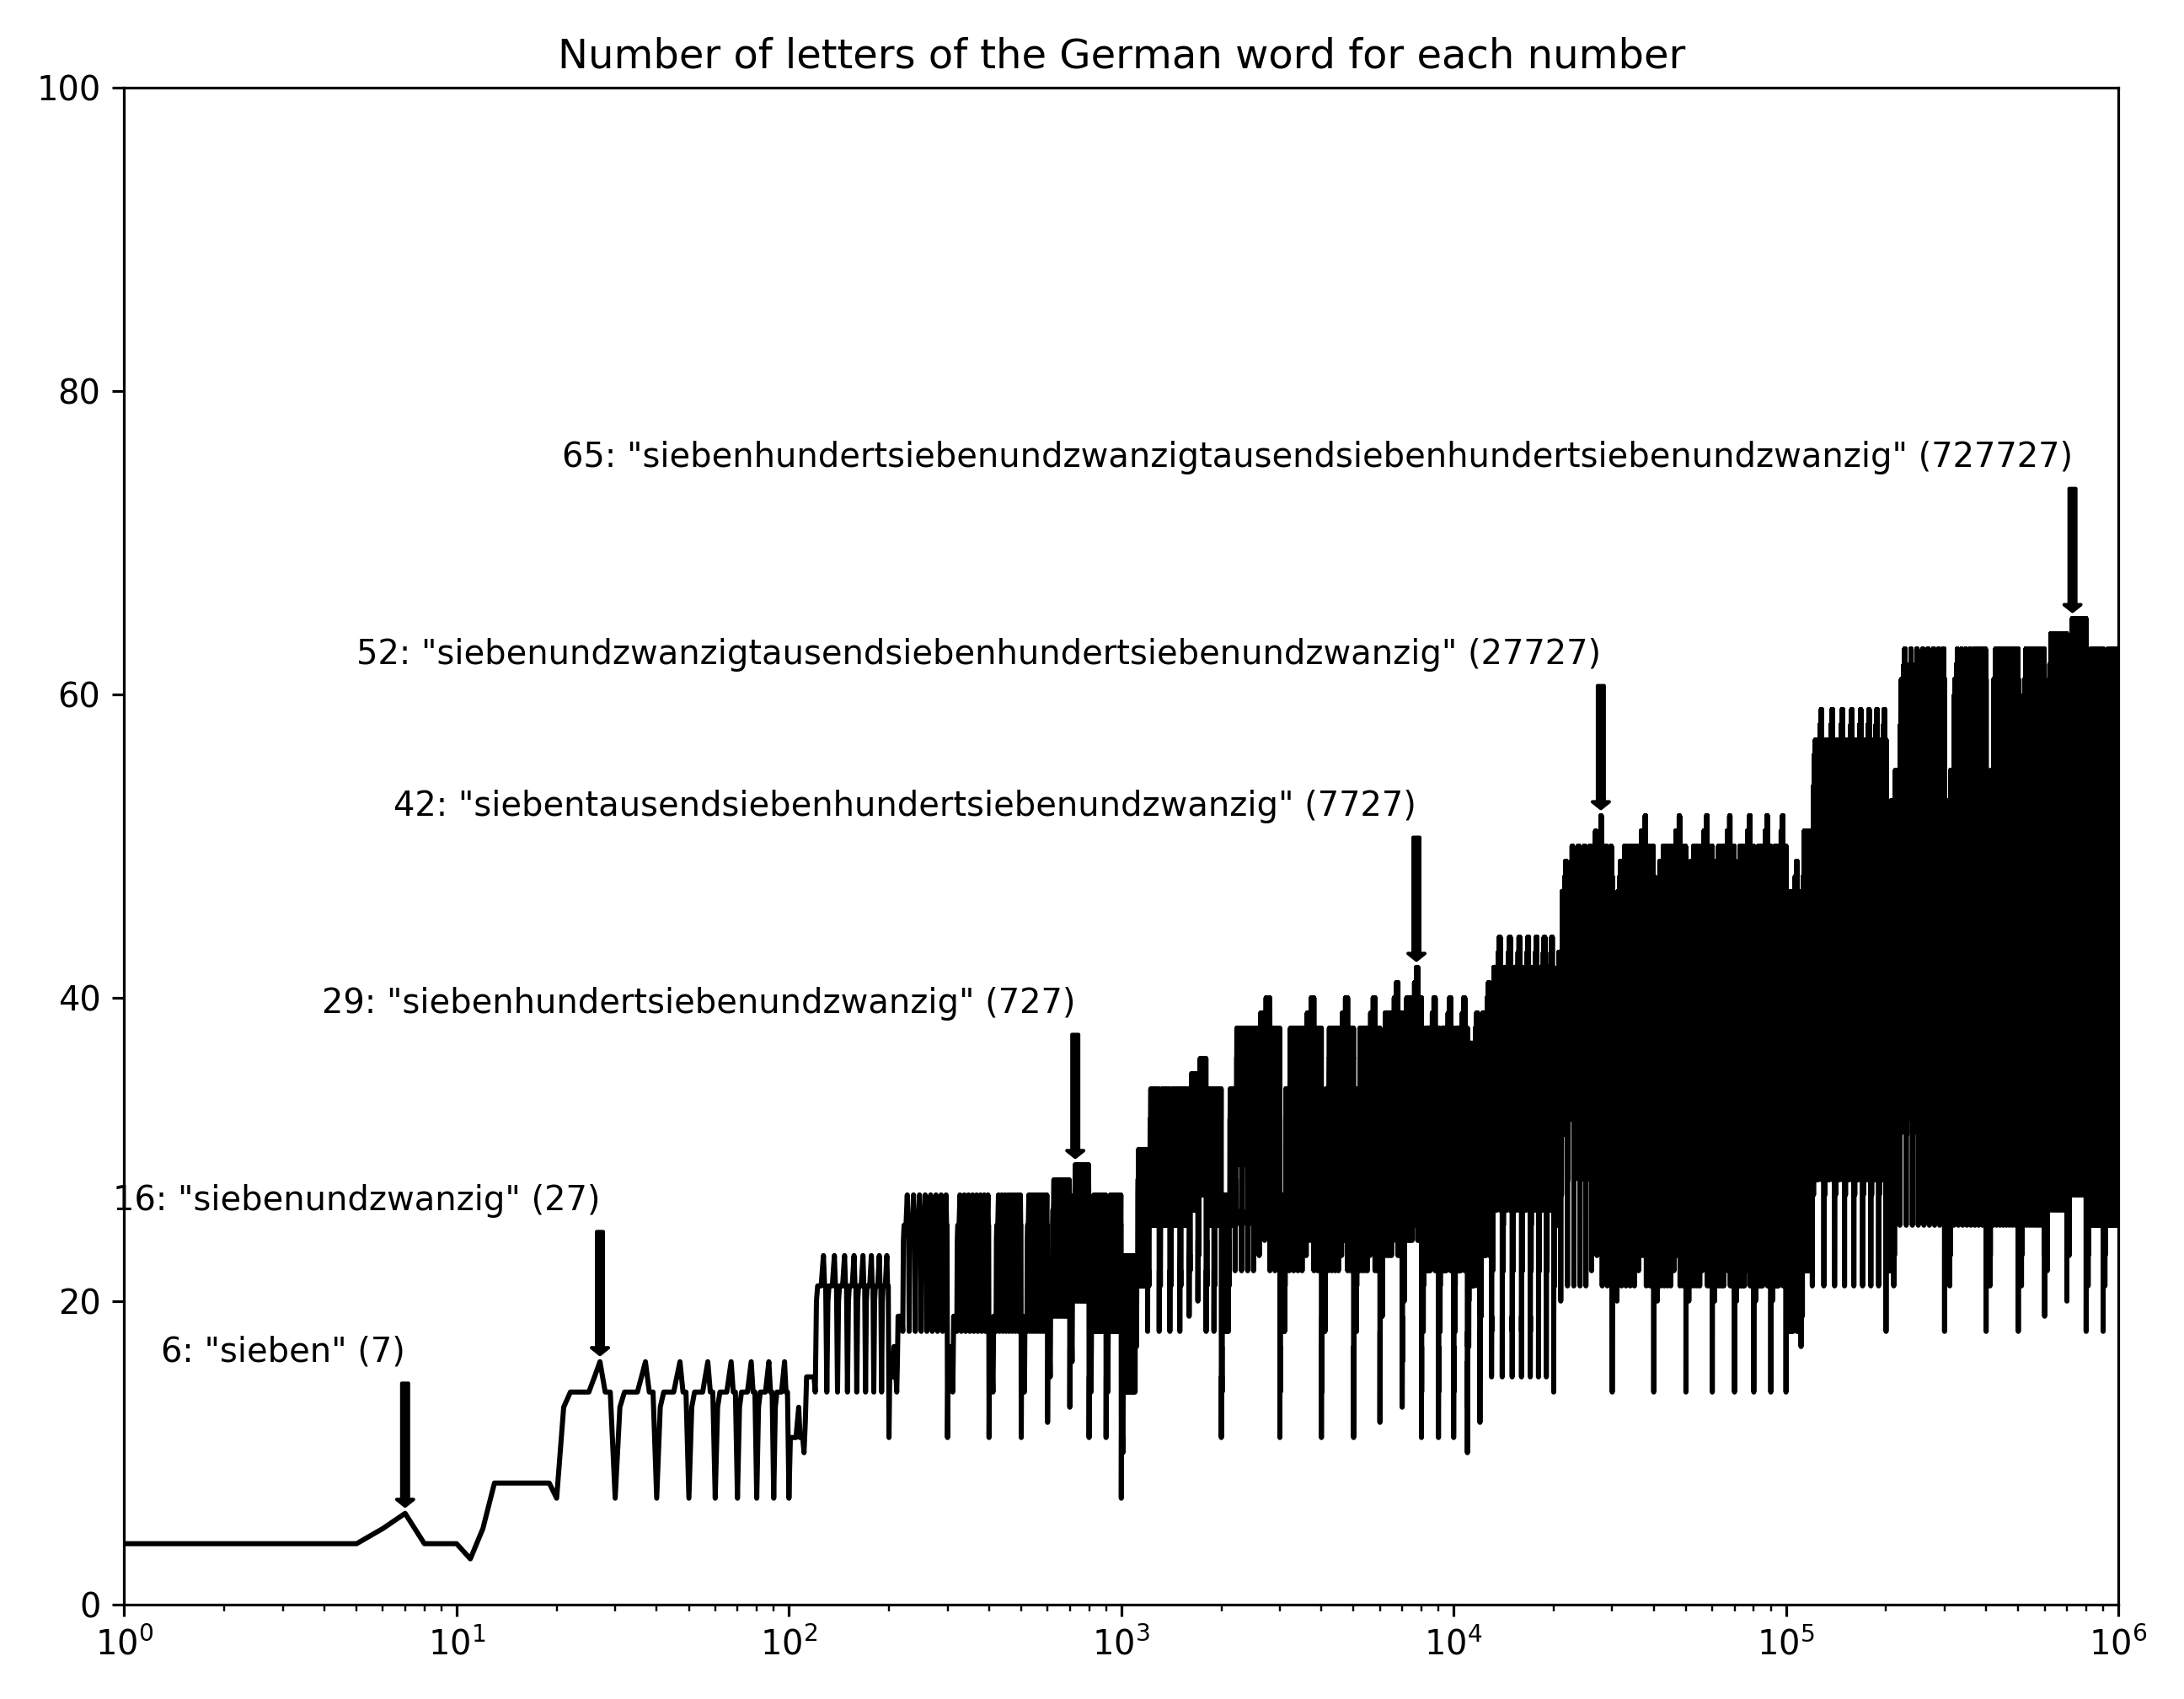
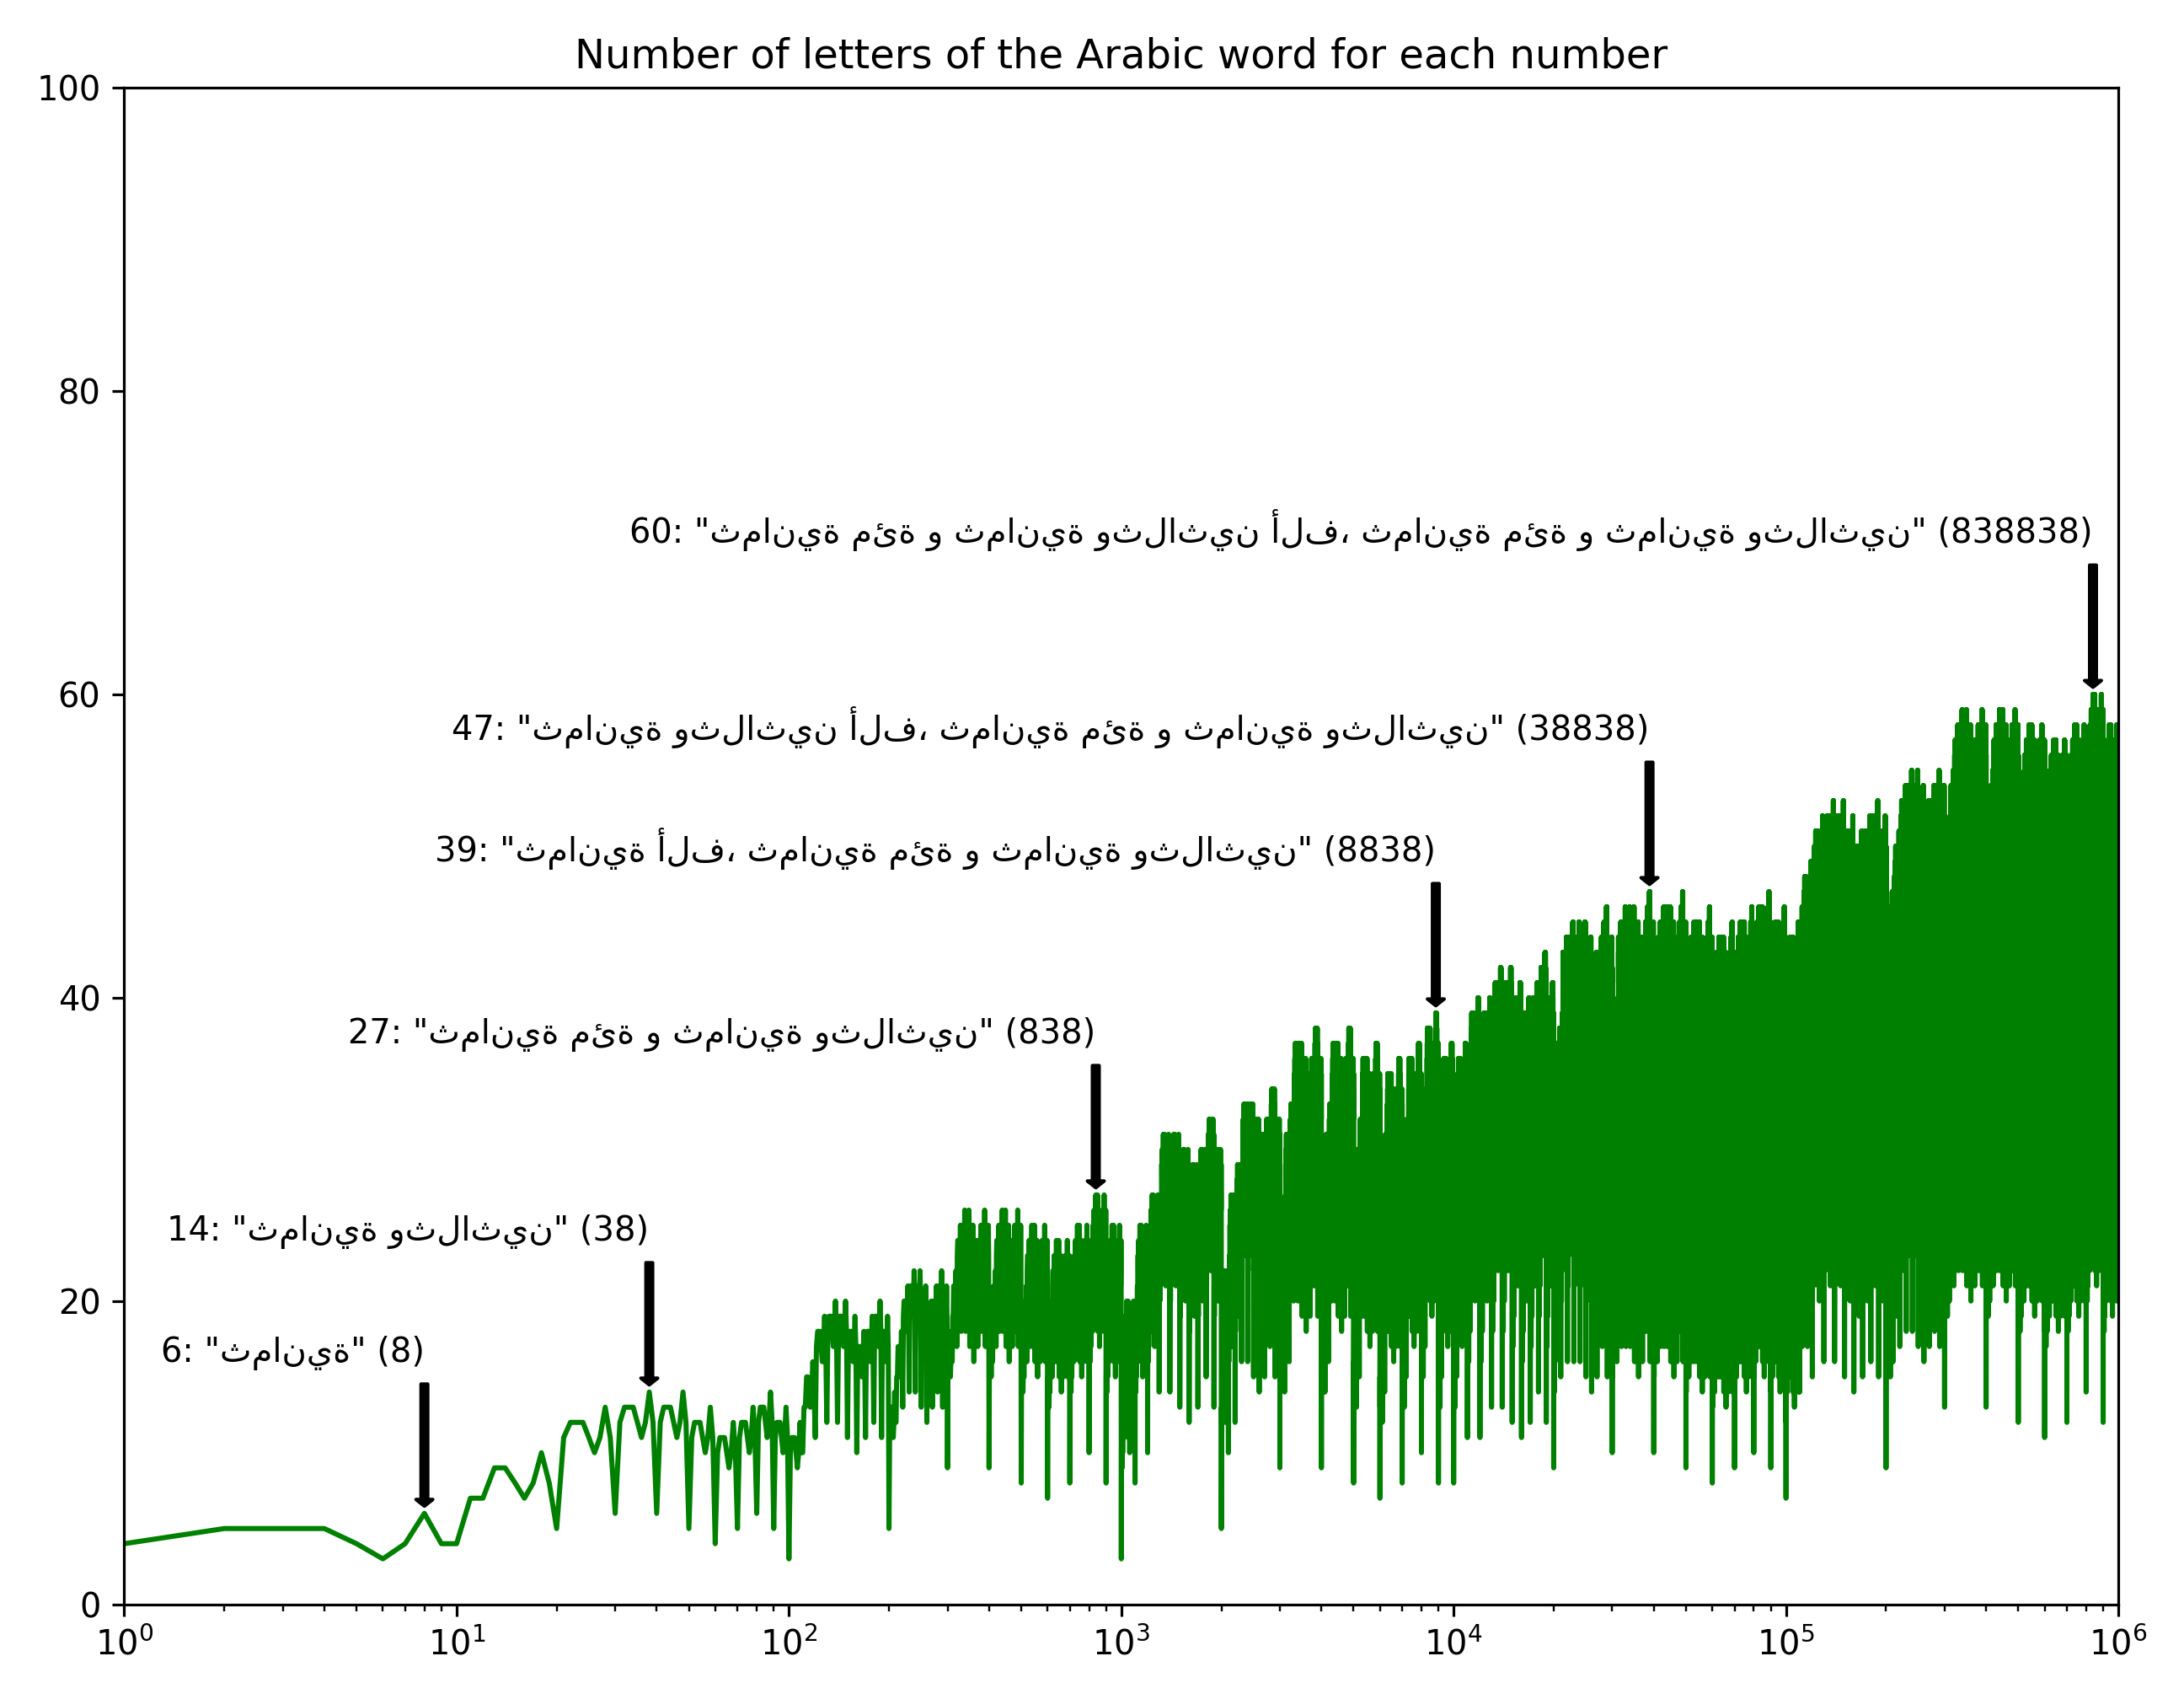
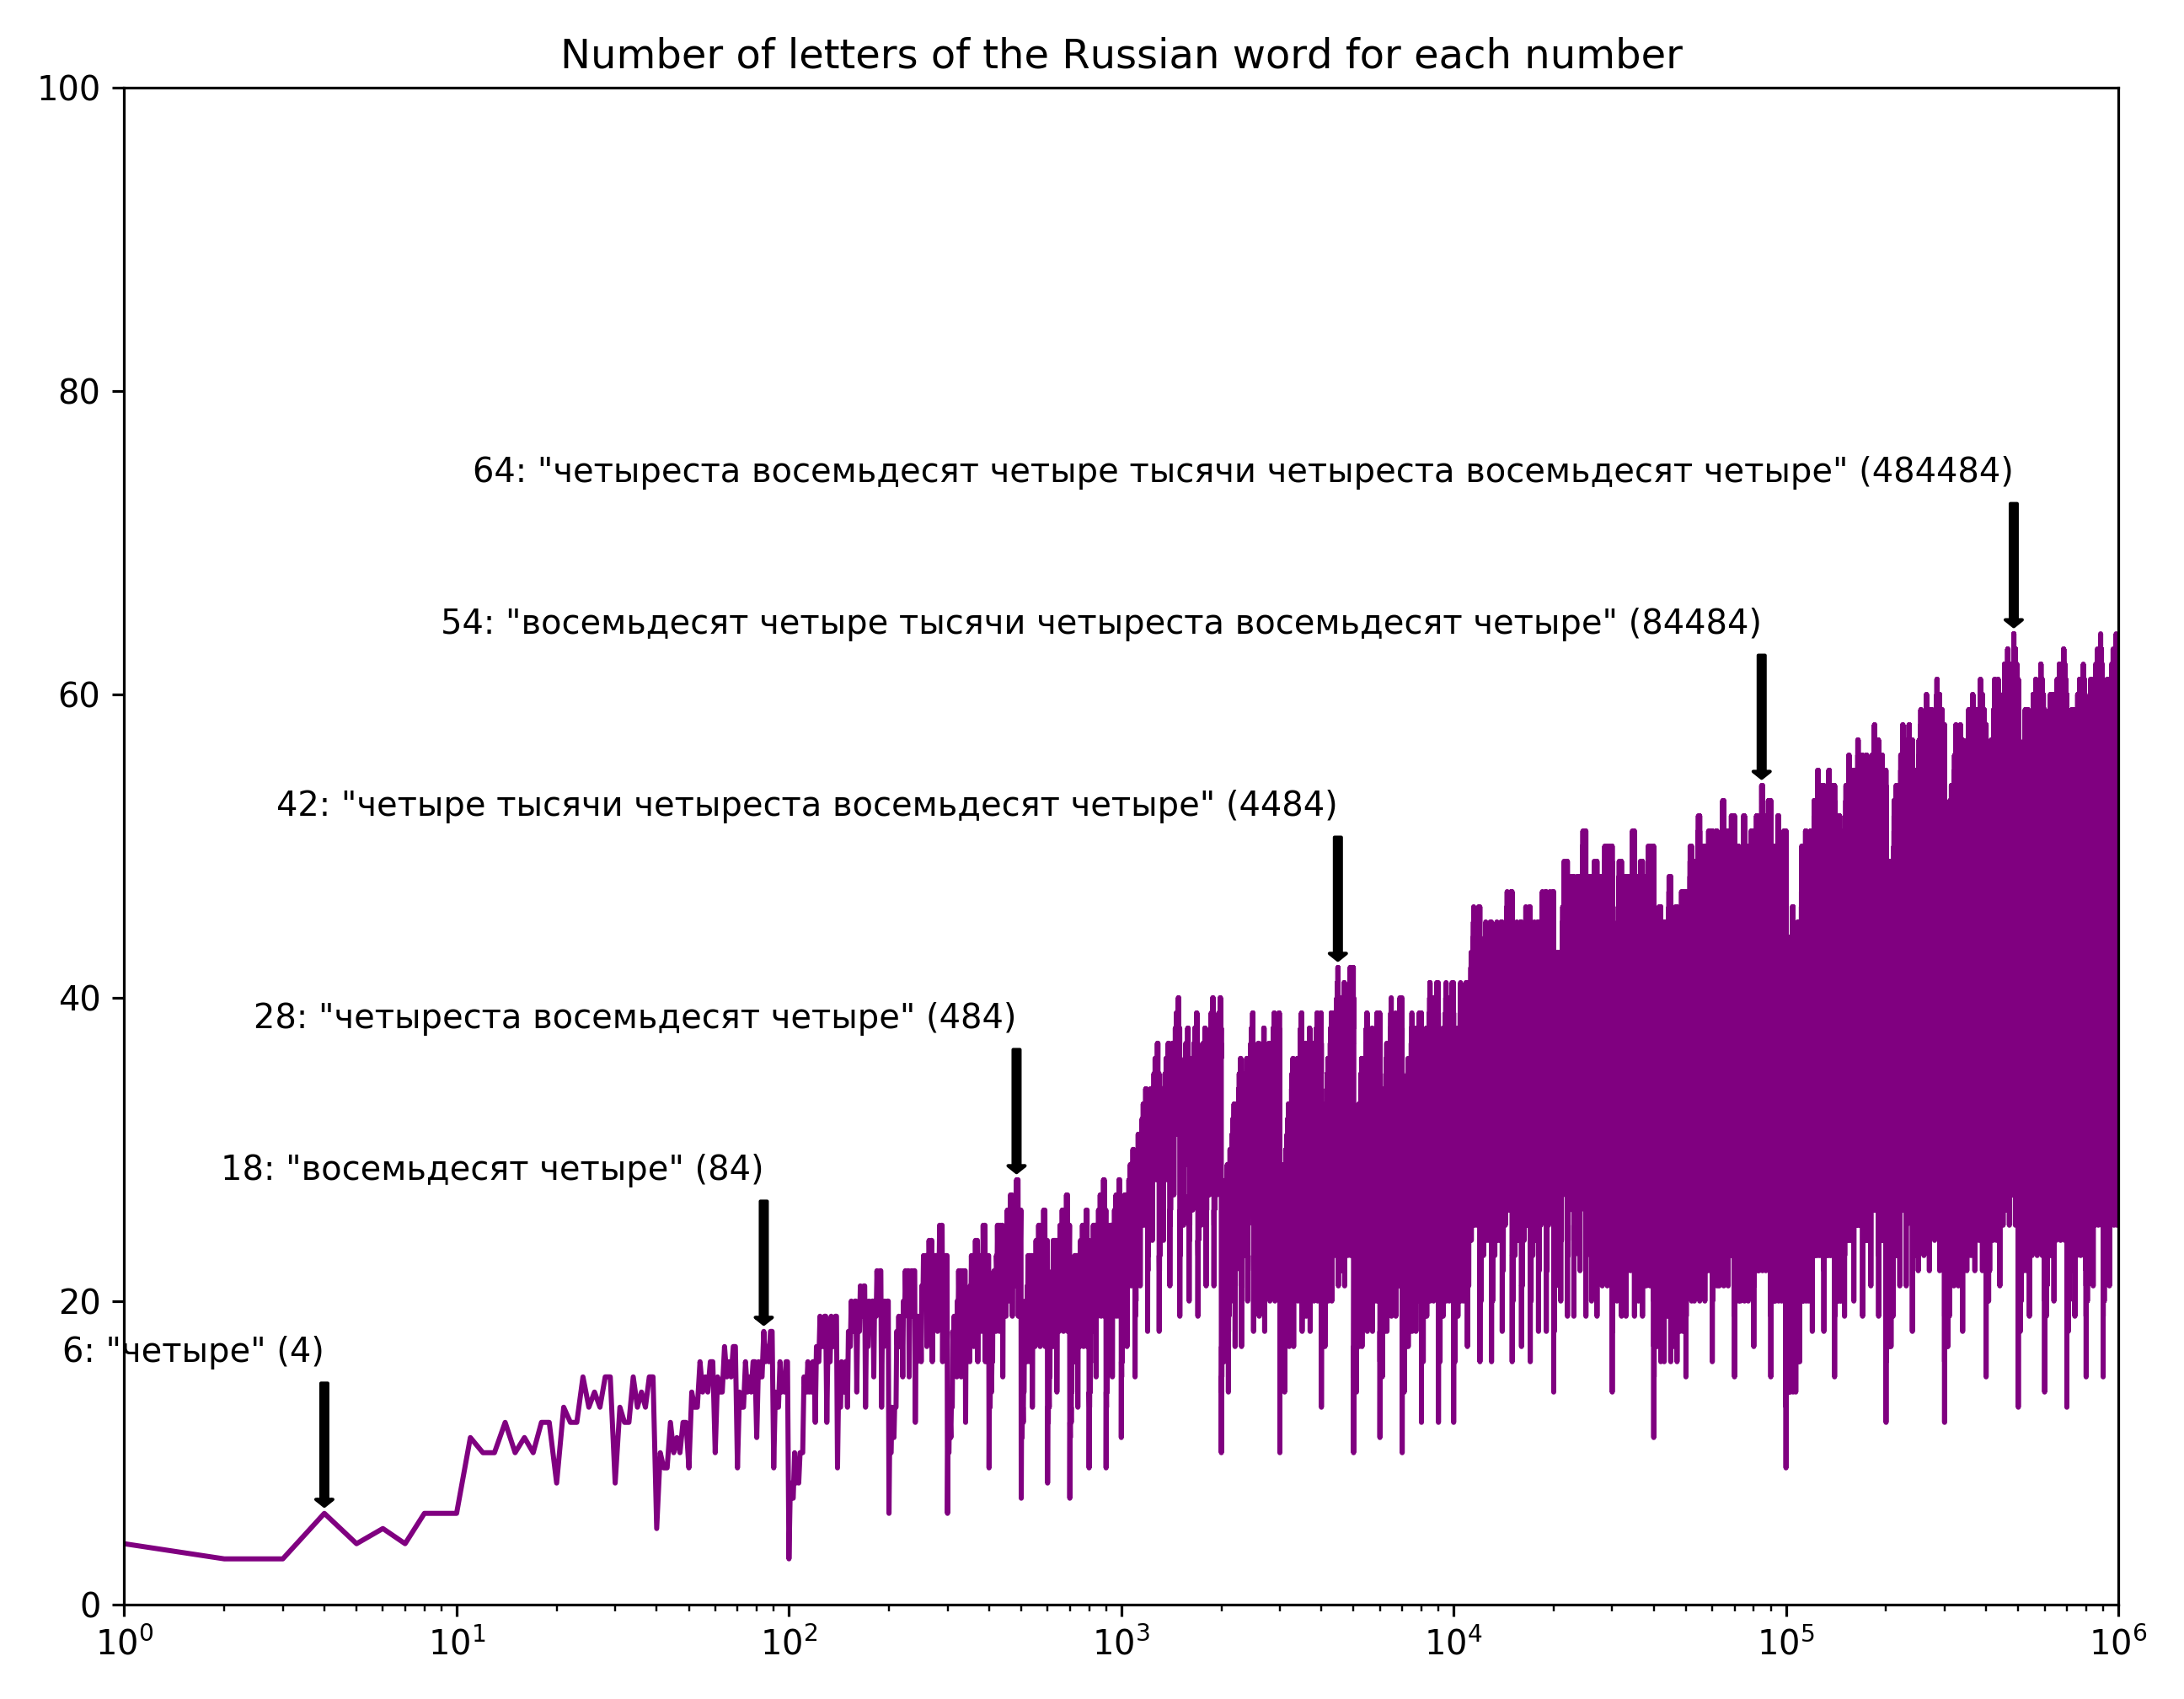
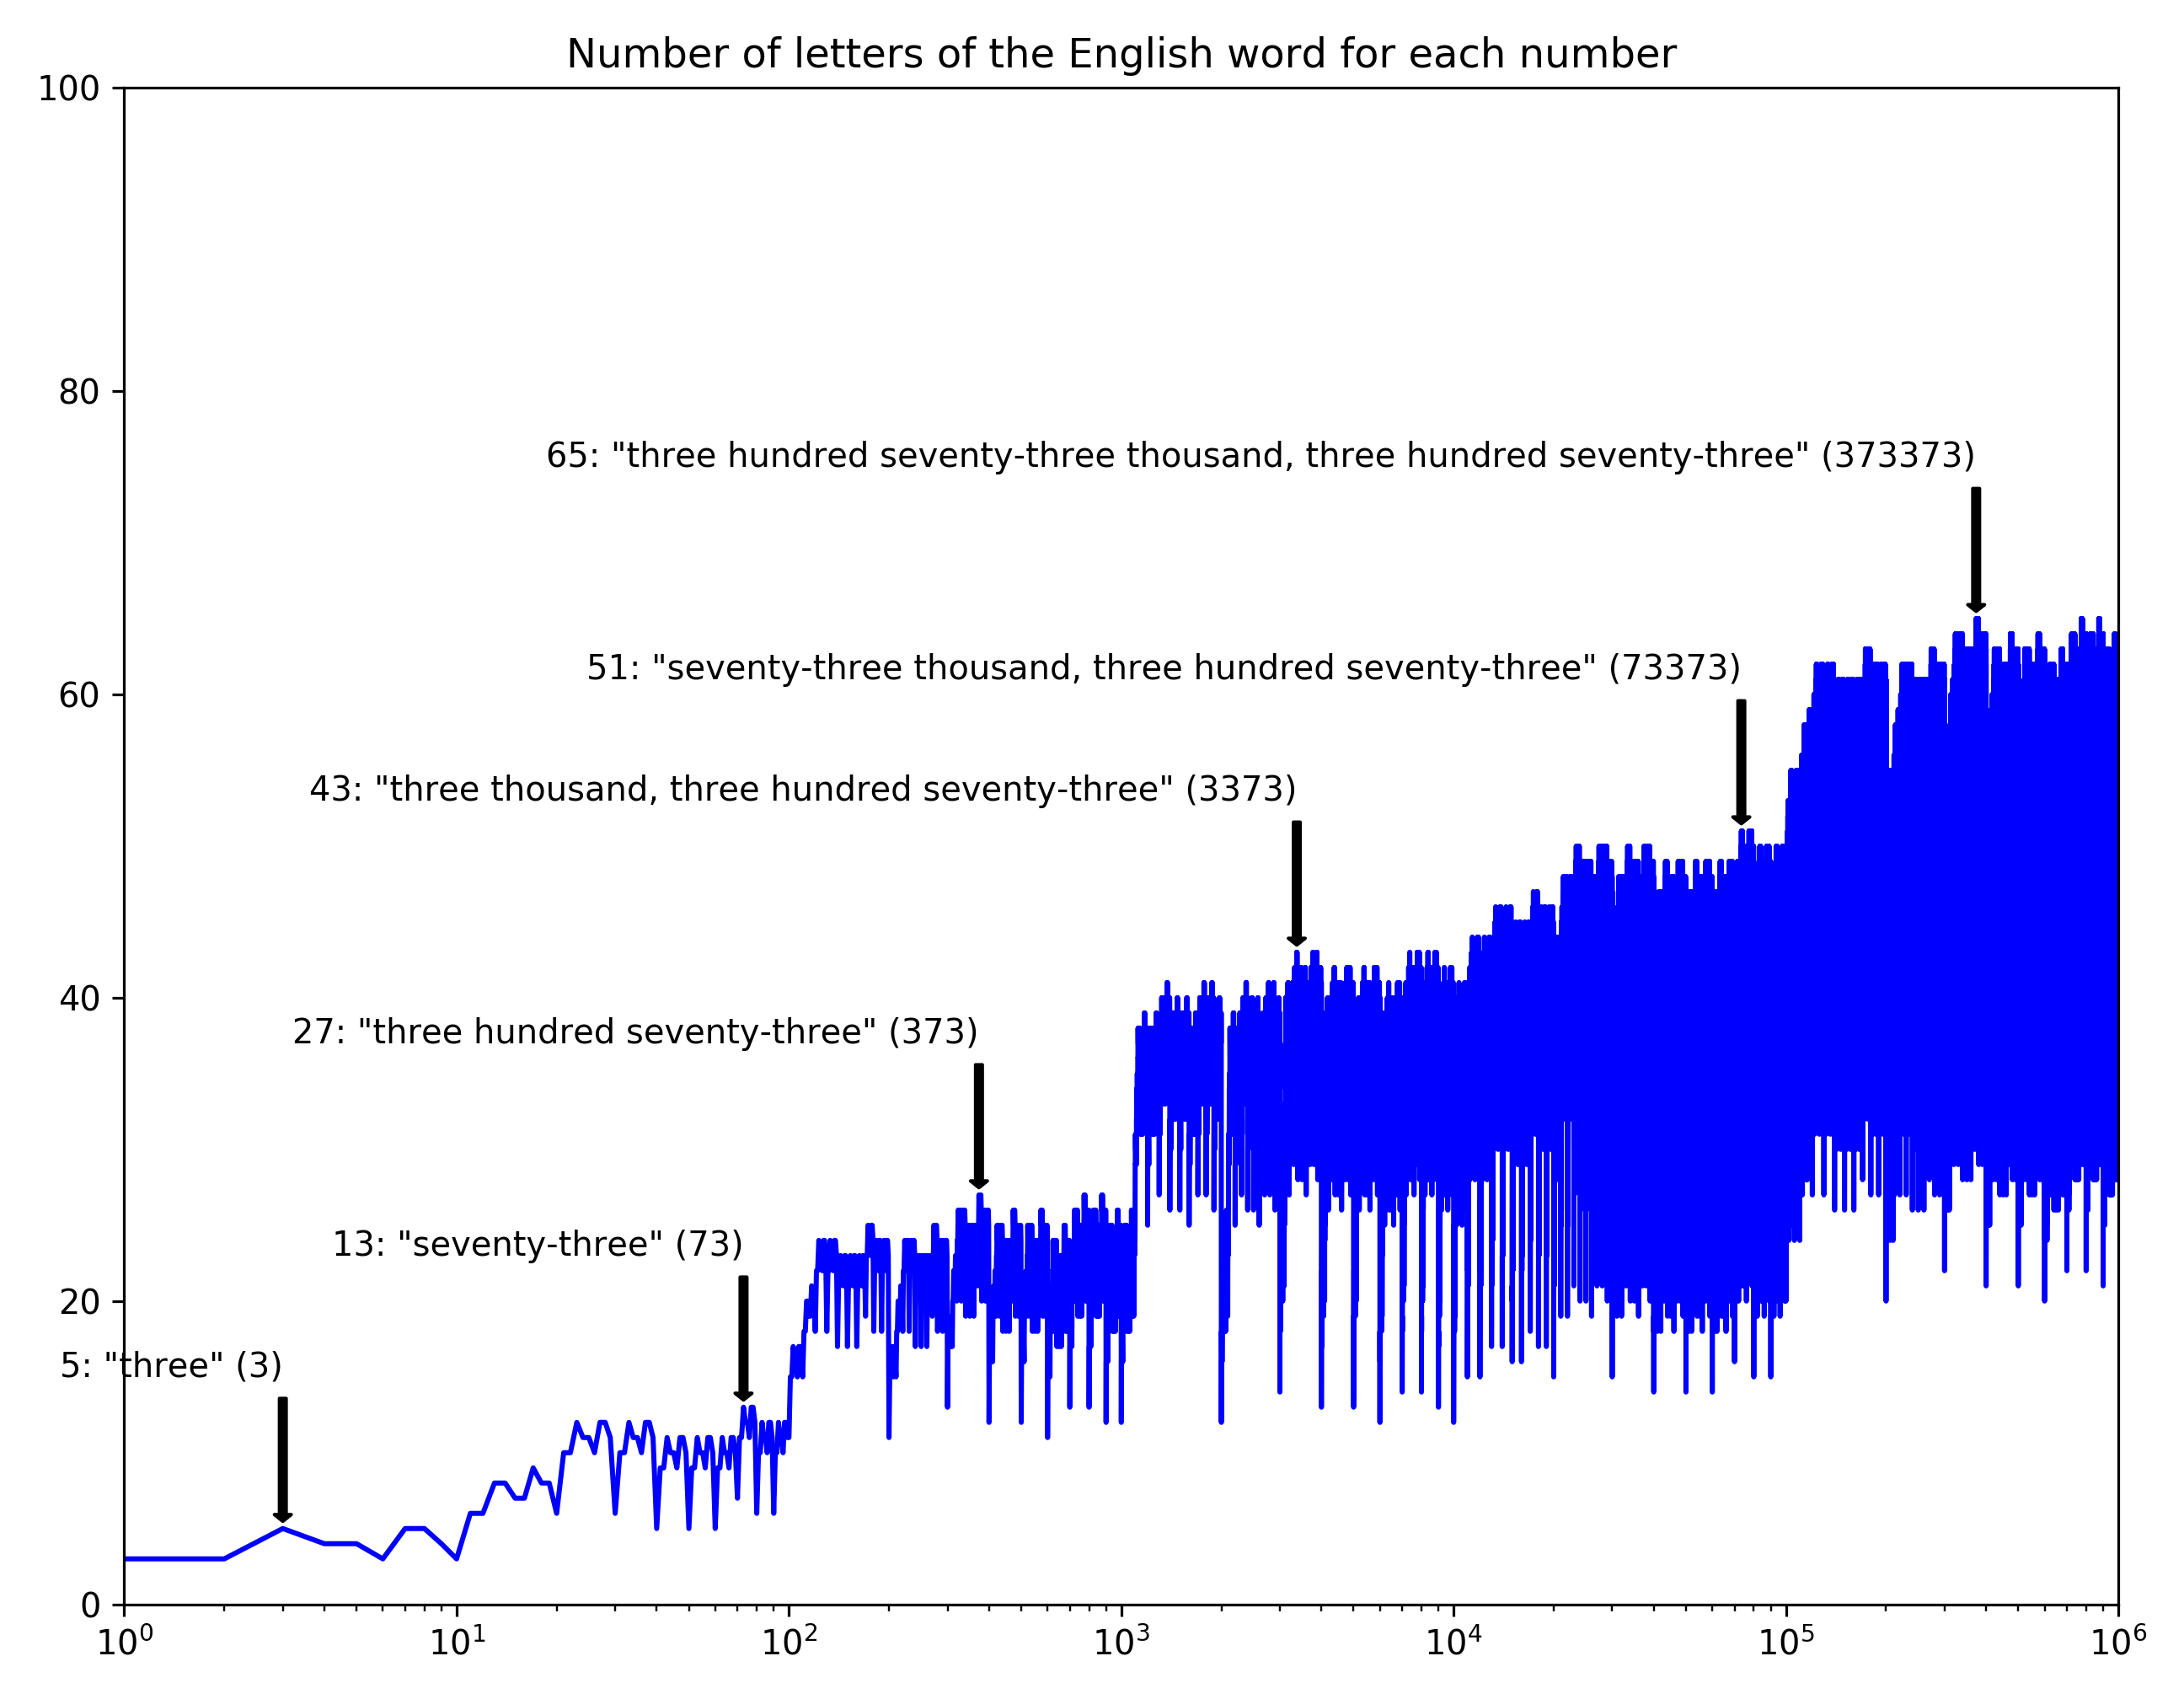
 More languages!!
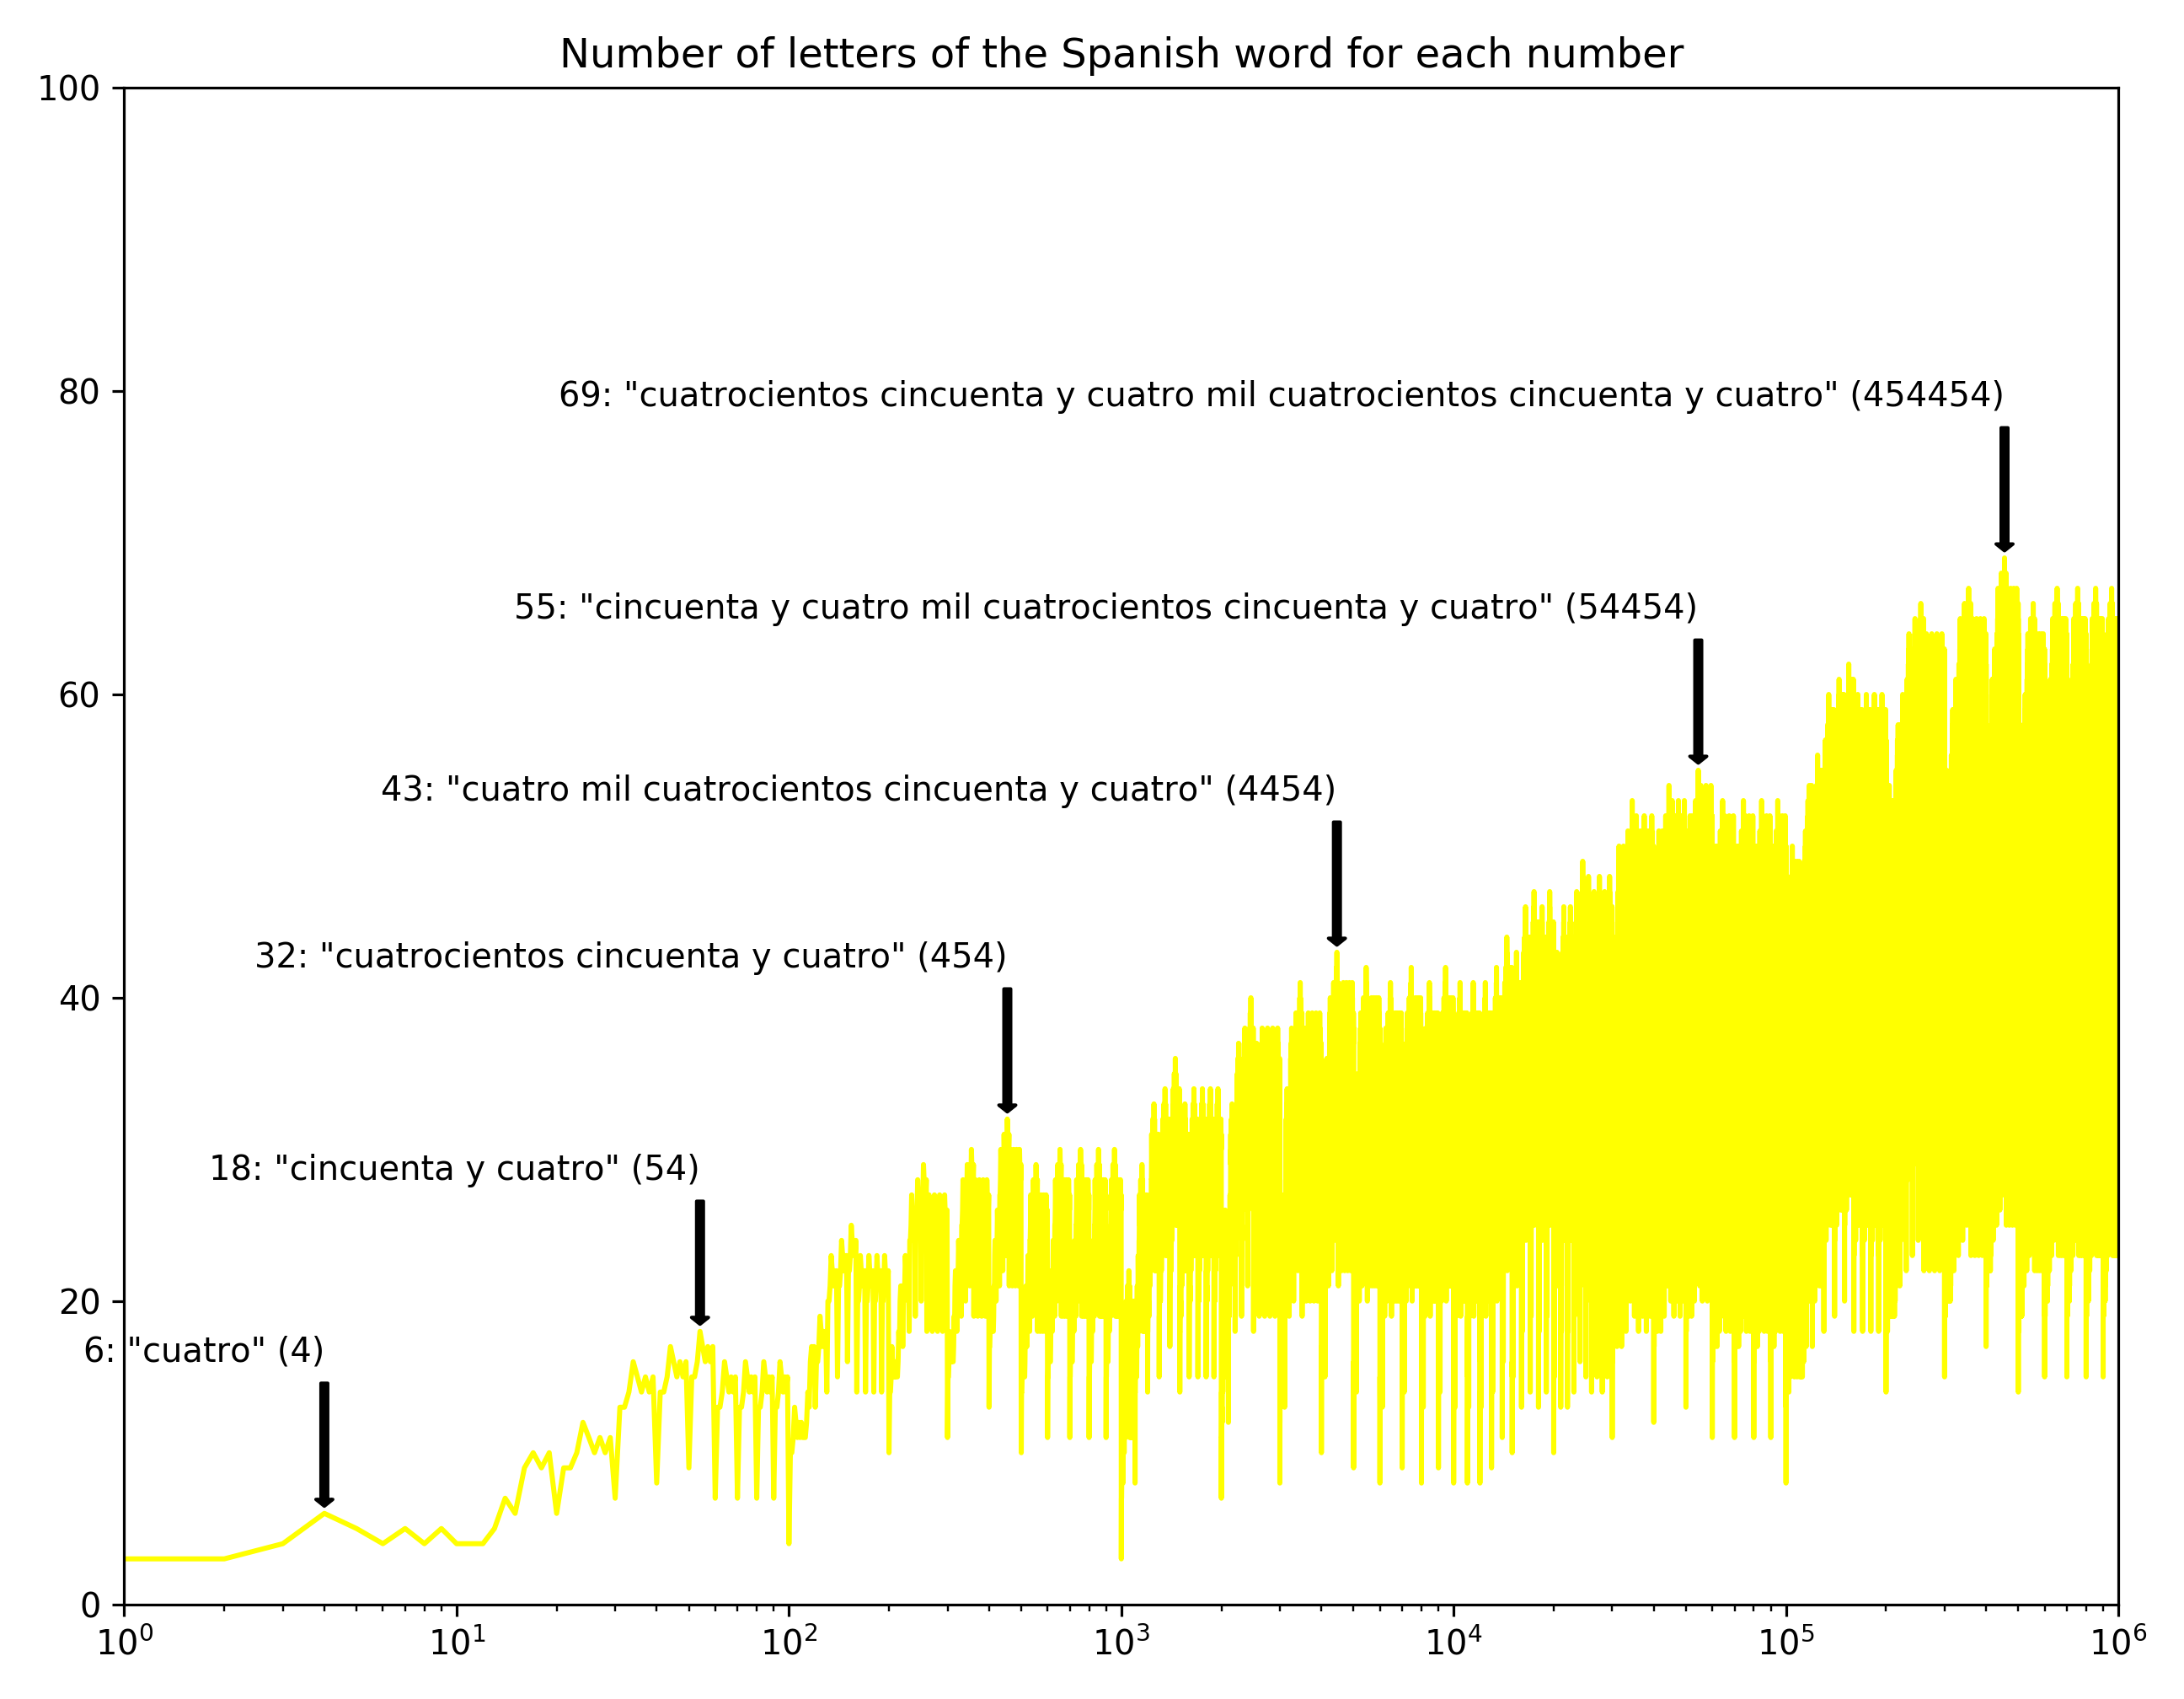 I love how Spanish has a few super compact words: “cien mil” for 100,000 for instance. Only eight letters, versus English “one hundred thousand” (20 letters).
I don’t know much about French but I think they have some kind of weird system based on 20s. Which by the way also Danish has.
If your stereotype of German is long words, you won’t be disappointed. Siebenhundertsiebenundzwanzigtausentsiebenhundertsiebenundzwanzig. But I also think that fascination is somewhat misguided — German (and many languages like Swedish) just compounds words when other languages would put a space in between. Big deal.
But anyway, speaking of stereotypes, look at the regularity of this chart. Ordnung muss sein. Turns out the reason is mostly that the German words for multiple of ten all have the same length: zwanzig, dreißig, vierzig, fünfzig, …
Overall, I kind of like the jagged form of the curves… there’s something fractal about it.
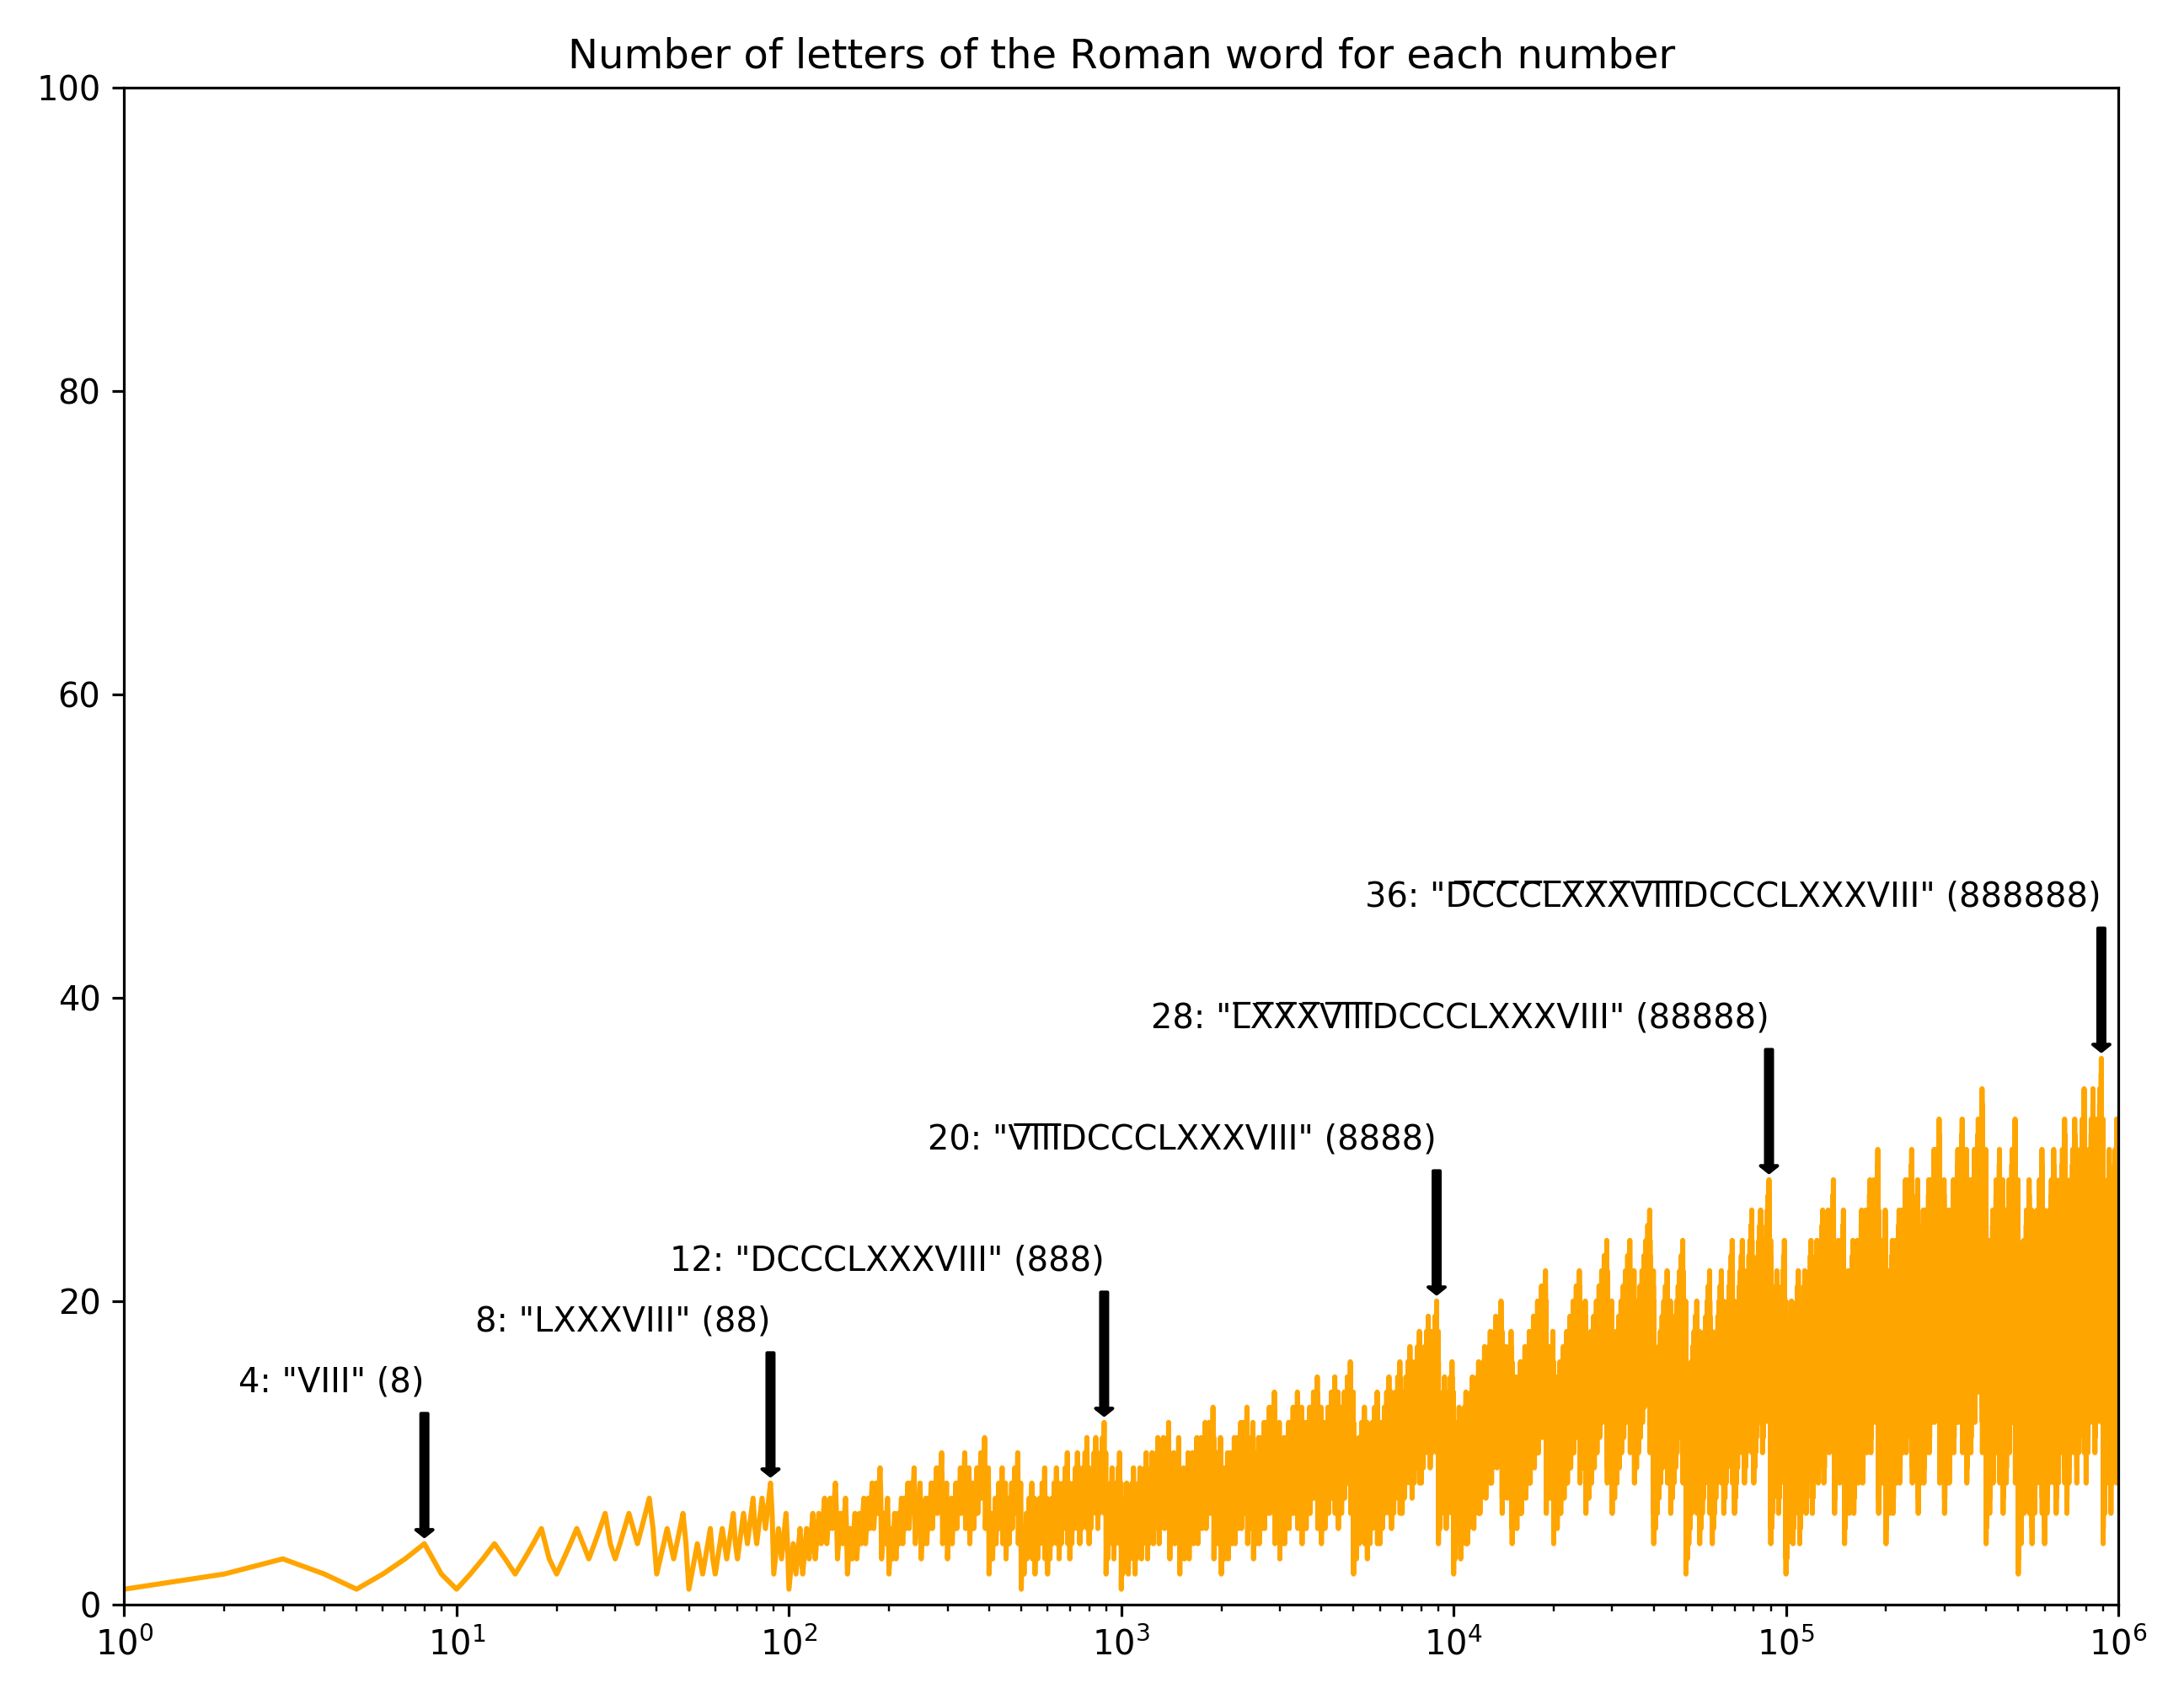
Roman numerals… because I don’t have anything better to do:
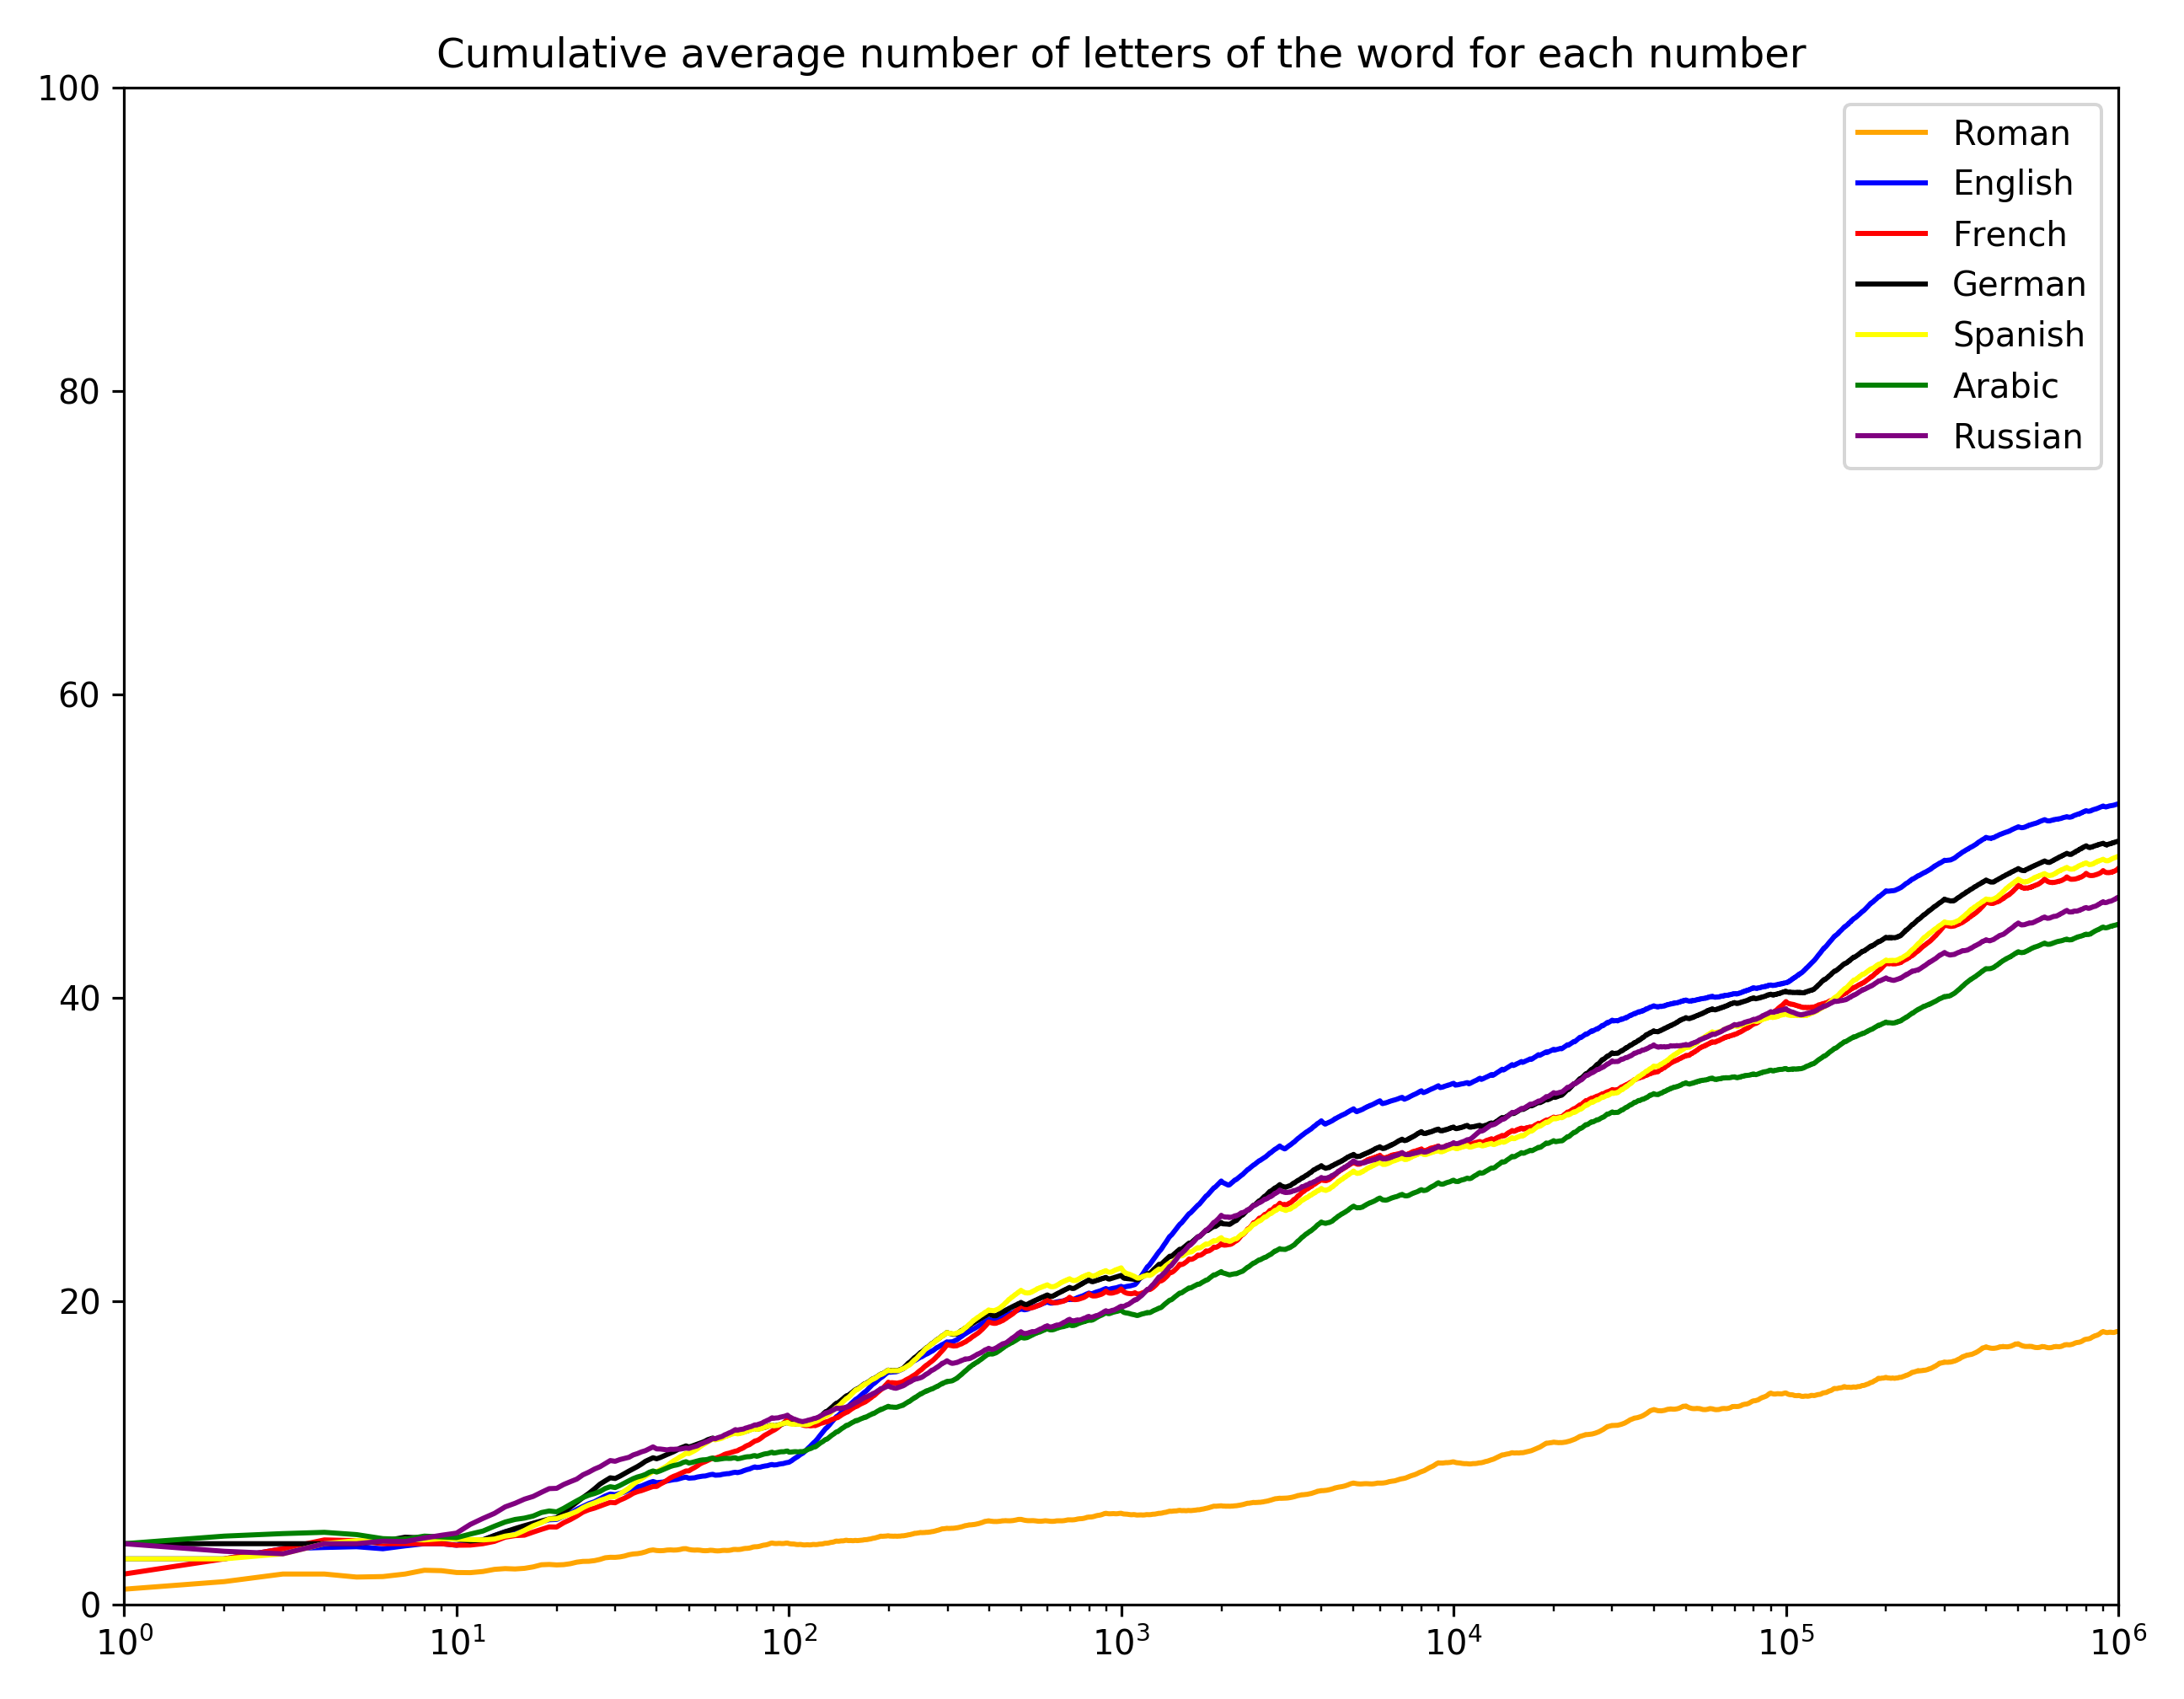
Finally here’s the cumulative average length of each language, all on one chart:
It’s a bit interesting to note that English has longer words than any of the other languages. And Arabic seems most compact, which is sort of interesting.
All of this was done using the num2words Python library. Full code below:
from num2words import num2words
from matplotlib import pyplot
import numpy
import roman

def l(lang):
    return lambda i: num2words(i, lang=lang)

def r(i):
    if i == 0: return 'nulla'
    if i < 5000: return roman.toRoman(i)
    else: return ''.join(c + 'u0305' for c in roman.toRoman(i//1000)) +
        (i%1000 and roman.toRoman(i%1000) or '')

data = []
for lang, func, language, color in [
        ('ro', r, 'Roman', 'orange'),
        ('en', lambda i: num2words(i).replace(' and', ''), 'English', 'blue'),
        ('fr', l('fr'), 'French', 'red'),
        ('de', l('de'), 'German', 'black'),
        ('es', l('es'), 'Spanish', 'yellow'),
        ('ar', l('ar'), 'Arabic', 'green'),
        ('ru', l('ru'), 'Russian', 'purple')]:
    words = [func(i) for i in range(1000000)]
    fig = pyplot.figure(dpi=288, figsize=(9, 7))
    ax = fig.add_subplot(111)

    lens = numpy.array([len(word) for word in words])
    ax.semilogx(lens, color=color)
    data.append((language, color, lens))

    for p in range(0, 6):
        lo, hi = 10**p, 10**(p+1)
        if hi > len(words):
            break
        x_max = max(range(lo, hi), key=lambda x: len(words[x]))
        kwargs = dict(horizontalalignment='right',
                      arrowprops=dict(shrink=0.05,
                                      width=2.0,
                                      headwidth=5.0,
                                      headlength=2.0,
                                      facecolor='black'))
        ax.annotate('%d: "%s" (%d)' % (len(words[x_max]), words[x_max], x_max),
                    xy=(x_max, len(words[x_max])),
                    xytext=(x_max, len(words[x_max])+10), **kwargs)

    pyplot.xlim([1, len(words)])
    pyplot.ylim([0, 100])
    pyplot.title('Number of letters of the %s word for each number' % language)
    pyplot.tight_layout()
    pyplot.savefig('num-letters-%s.png' % lang)

fig = pyplot.figure(dpi=288, figsize=(9, 7))
ax = fig.add_subplot(111)
for language, color, lens in data:
    avgs = numpy.cumsum(lens[1:]) / (numpy.arange(1, len(lens)))
    ax.semilogx(numpy.arange(1, len(lens)),
                avgs,
                color=color,
                label=language)
pyplot.xlim([1, len(lens)])
pyplot.ylim([0, 100])
pyplot.legend()
pyplot.title('Cumulative average number of letters of the word for each number')
pyplot.tight_layout()
pyplot.savefig('num-letters-avg.png')
Original Source


