This is the third article in a series about changes in support for gun control over the last 50 years.
In the first article I looked at data from the General Social Survey and found that young adults are less likely than previous generations to support gun control.
In the second article I looked at data from the CIRP Freshman Survey and found that even the youngest adults, who grew up with lockdown drills and graphic news coverage of school shootings, are still LESS likely to support gun control.
Untangling age, period, and cohort effects
In this article, I do some age-period-cohort analysis to see if the changes over the last 50 years are due to age, period, or cohort effects:
Age effect: People’s views might change over the course of their lives. For example, they might be more likely to support gun rights when they are young, and more likely to support gun control when they have children. (This turns out not to be true.)
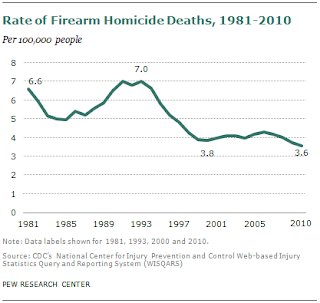
Period effect: People’s views might change due to an external factor that affects all age groups and cohorts over the same time period. For example, if gun crime rates increase, we might expect support for gun control to increase. (There is some evidence for this.)
Cohort effect: People’s views might be different from one generation to the next, due to differences in the environment. For example, current teenagers might support gun control because of their experiences with school shootings. (This turns out not to be true.)
As the composition of the population changes over time, it can be hard to untangle these effects, but the design of the Generation Social Survey (GSS) makes it possible. From 1972 to 2016, the GSS asked respondents
Would you favor or oppose a law which would require a person to obtain a police permit before he or she could buy a gun?
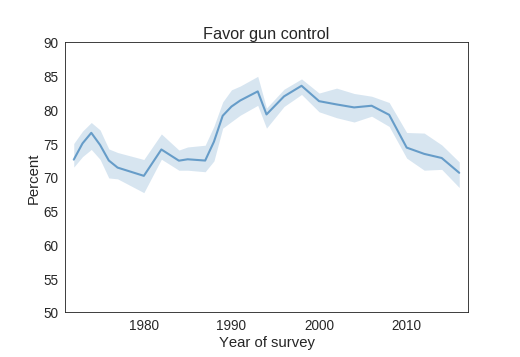
The following figure shows the fraction of respondents who would favor this law:
In the 1970s and 80s, support for this policy was near 75%. It increased during the 1990s, peaking near 85% around 2000, and has been declining ever since. In the most recent survey year, it is at 71%.
Testing for age effects
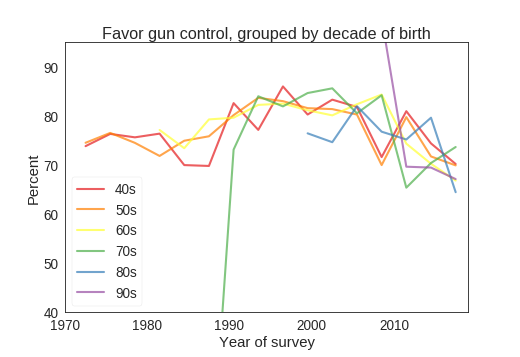
To test for age effects, we can group respondents into cohorts by decade of birth and plot support for gun control as a function of age.
If there is an age effect we would expect all cohorts to follow a similar trajectory as they age. For example, if people are more likely to support gun control during their child-bearing years, we would expect these line to generally increase from left to right.
Here are the results:
There are no obvious patterns here, which suggest that there is no age effect.
Testing for period effects
To test for period effects, we group by decade of birth again, and plot the results over time. If there is a period effect, we expect all cohorts to follow a similar trajectory.
Here are the results:
This figure shows clear evidence for a period effect: all cohorts follow a similar trajectory over the same period. (Don’t be distracted by the extreme first points in the green and purple curves; they are based on a small number of respondents.)
Looking at the last few points in each cohort, it looks like people born in the 1980s and 90s are less likely to support gun control than previous generations, but this figure does not show strong evidence for a cohort effect.
In summary, there is strong evidence for a period effect: support for gun control increased among all groups increased during the 1980s and 90s, and has been falling in all groups since 2000.
Violent crime rates
To investigate this more carefully, I would like to see a graph of people’s perception of violent crime rates, which does not always track reality.
Breakdown by political views
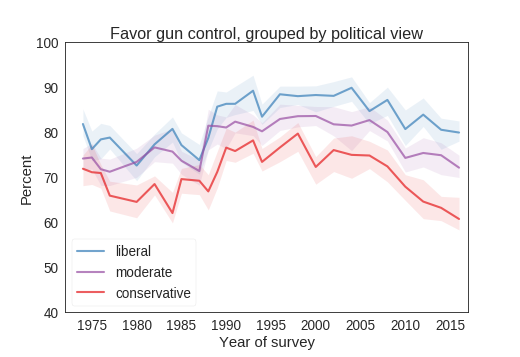
In general, liberals are more likely to support gun control than conservatives; we might expect a period effect to have different impact on different groups. The following figure shows support for gun control over time, grouped by self-reported political identity:
Whatever external forces caused the increase and subsequent decrease in support for gun control, it affected all groups over the same period. The most recent decreases seems to be bigger among conservatives, so the gap may be growing.
Breakdown by race
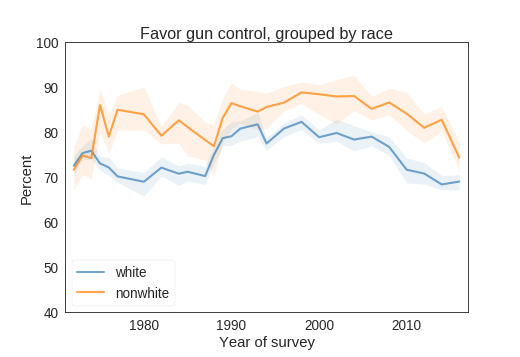
Nonwhites are more likely to support gun control than whites by about 8 percentage points. The following figure shows how this difference has changed over time:
Both groups were affected similarly over the same period. Among nonwhites, support for gun control might have increased sooner, in the 1980s, and might be falling more slowly now.
——————–


