The Wireshark’s Flow graph feature displays the sender and a receiver view of the packet flow. The window shows connections between hosts. It is very helpful for network analysis and packet capturing. We can analyze the traffic flow of data. We can check the network latency with the help of these you can analyze the flow of traffic which is between two conversations or sources or destinations. With the help of this flow graph, we can check how much duplicate acknowledgement will be occurring in our network.
Flow Graph for a Trace File :
To open the “Flow Graph” in Wireshark for a trace file follow the below steps:
- Start the Wireshark by selecting the network we want to analyze.
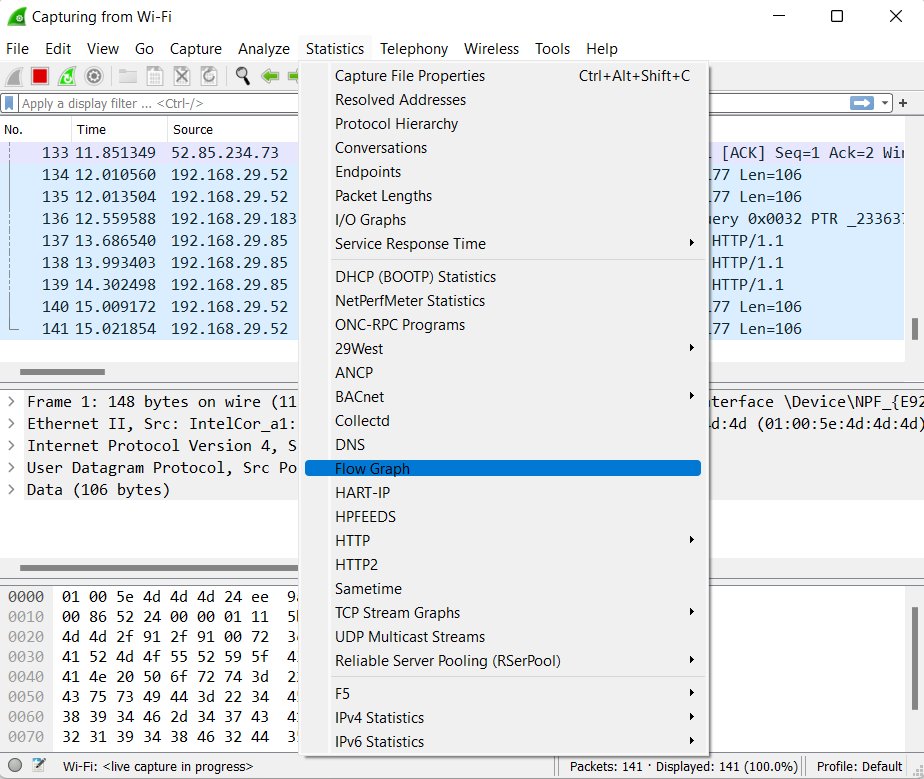
- Now go into the Wireshark and click on Statistics→ Flow Graph menu or toolbar item.

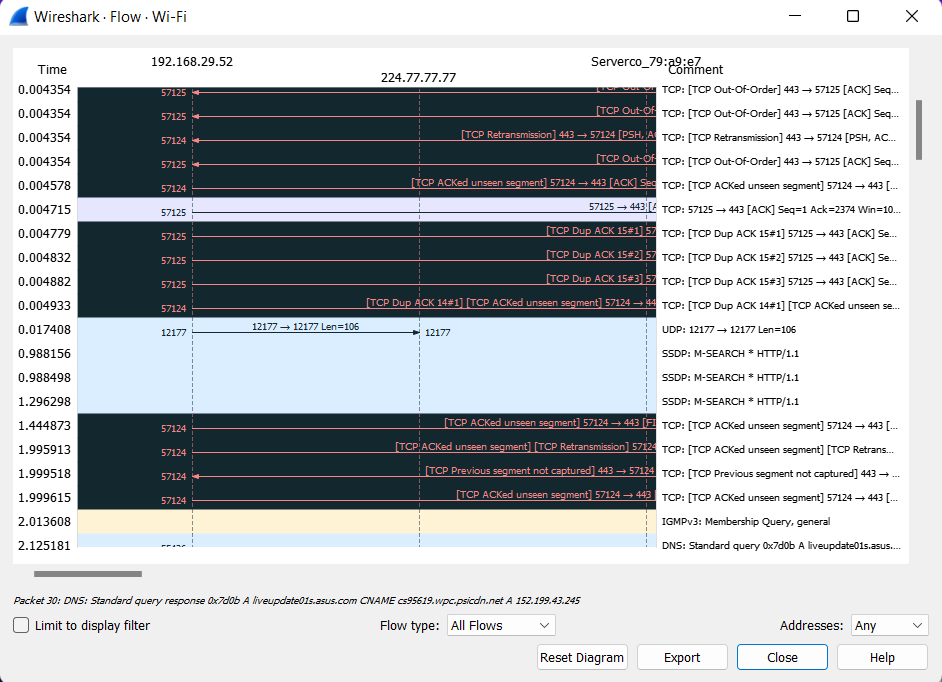
This will then bring up Wireshark’s “Flow Graph” window.

The screenshot above of the Flow Graph window displays issues with a TCP connection, such as timeouts, re-transmitted frames, or dropped connections.
Note:
- Each vertical line in the graph represents the specific host.
- The numbers present at the left of the Flow Graph window represent the time packet. We can also change the format in the View → Time Display Format menu or toolbar item. To apply the changes we must relaunch the Flow Graph window to observe the time in a new format.
- The number present at both ends of each horizontal arrow between two hosts represents the port numbers.
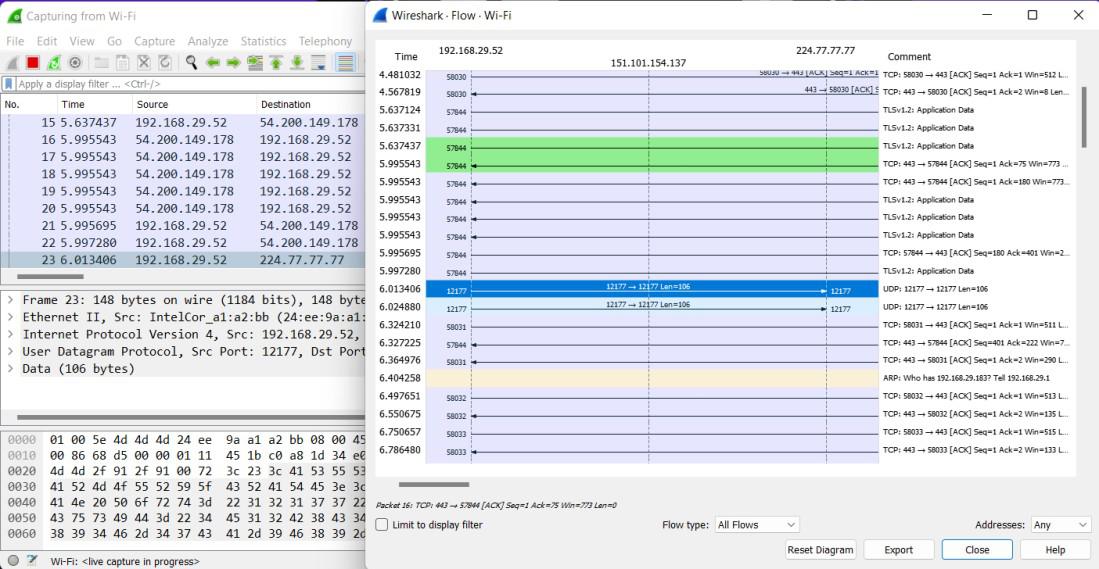
- If we select any packet in the Flow Graph that packet is automatically highlighted in the main Wireshark window.

Control of Flow Graph Window:
- Limit to display filter: It displays all the connections matching the display filter. If the display filter is active the checkbox is checked.
- Flow type: limits the type of protocol flows.
- Addresses: It allows switching shown addresses in the diagram
- Reset Diagram: It resets the view position and zooms to the default state.
- Export: It allows us to export diagrams as images in multiple different formats like PDF, PNG, BMP, JPEG, etc.


