The Collectd is a system statistics collection daemon (a program that runs as a background process without any interactive user interface) that collects system and application performance metrics periodically and also provides mechanisms to store and manage the values in many ways, for example in RRD files. It organizes and collects various statistics information from your system and application and converts it to such form that is used by the network.
The protocol used by the Network plugin is a binary protocol. This protocol is implemented to exchange data gathered by collectd or to send data to an instance of collectd.
Collectd Statistics Window
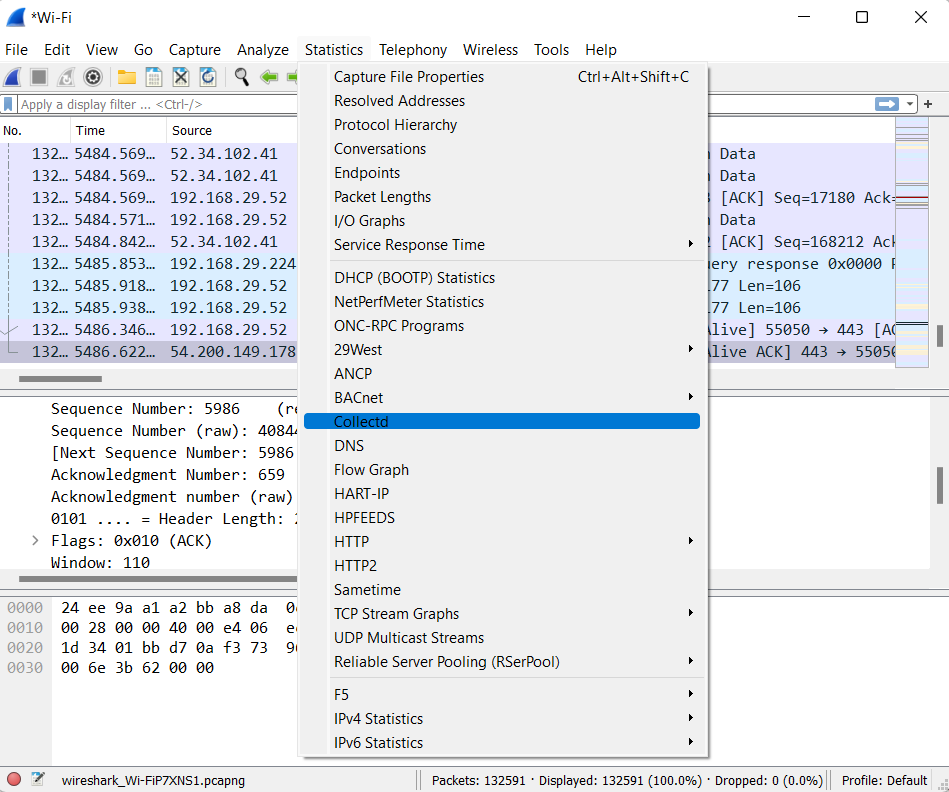
To open the “Collectd Statistics Window” in Wireshark follow the below steps:
- Start the Wireshark by selecting the network we want to analyze.
- Now go into the Wireshark and click on Statistics→ Collectd menu or toolbar item.

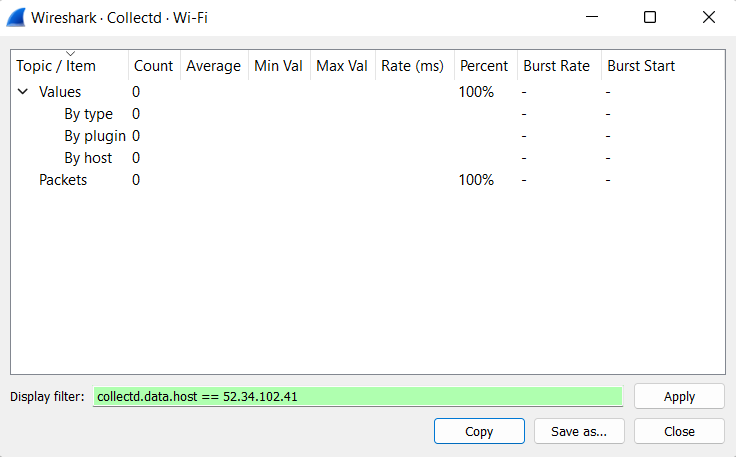
This will then bring up the “Collectd Statistics Window” dialogue box.

The above screenshot of the Collectd statistics window displays counts for Values, which are divided into type, plugin, and host as well as total Packets counter. We can copy or save the data to a simple text file. We can also enter the filter primitive we want to apply to packets.
The measurements of collectd do not simply happen on their own we need a tool to actually do the work of collecting and visualizing the metrics. The metrics data sources consist of.
- Timestamp
- Metric name
- Measurement or a data point
- Dimensions (describing the host kind of instance or other attributes to filter or sort metrics on)
These four elements help in monitoring the system and applications performance such as:
- Insights on workload
- Memory usage
- I/O and server storage over a specific frame of time


