This article was published as a part of the Data Science Blogathon
One thing that comes to our mind after hearing Big Data Analytics is that this field might be somewhat related to Data Science right? So starting with the answer, yes it’s related to the same the only difference is, in Big Data Analytics, analysts work on a huge amount of data. Big Data Analytics refers to data insights. It is the process of finding important data, patterns, market trends, relationships, and user needs. With the advancement of technology, it is quite possible to find and study any information and get the reports very quickly. The basic purpose is to provide better decision-making and to stay safe from fraudulent activities. This technology has many characteristics like big volume, faster rate. Artificial Intelligence (AI), mobile, social media, and the Internet of Things (IoT) are operating data through new sources of data.
The concept of Big Data analytics was designed years ago. Most of the companies came to know that if they will store and collect the information related to their business, then after analyzing the data they can change their methods, to have better results. In the early 1950s, when the word big data was not even found, at that time many companies used this method. In the form of spreadsheets and in the form files which were examined by the people manually to find what is trending in the market. Speed and efficiency are the main advantages of this technology. The main benefit that companies are getting is that they have the potential to work at a faster pace.
How does Big Data Analytics work?
The working of BDA can be summarised in eight simple steps, which are as follows:
Step 1: Business case estimation– It is the first step in which the needs and goals of a company are analyzed, this step is also referred to as requirement analysis as in this stage we need to gather all the information about the requirement for which we need the BDA solution.

Stage 2: Recognition of information– At this stage, many sources that can provide a lot of information are seen and recognized. This step is also called as Data Gathering stage as we have to gather all the data from different sources in order to create a solution for the problem. This is the sole stage of the pipeline without which the whole BDA solution won’t work as without data there would be no insight.
Step 3: Data refining– Here, undesired data which was collected from the previous stage is removed. Sometimes data that we collect from multiple sources may not be compatible and also may not be of any use to us so we need to remove that data to tackle the compatibility issues in the future.
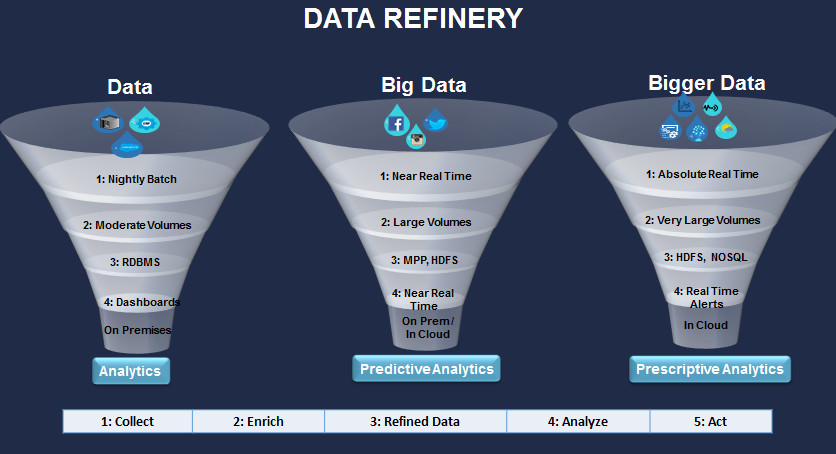
Stage 4: Data production– The data which is not appropriate is taken and then it is changed to a worthy form. Here the data is cleaned according to the usecases and algorithms.
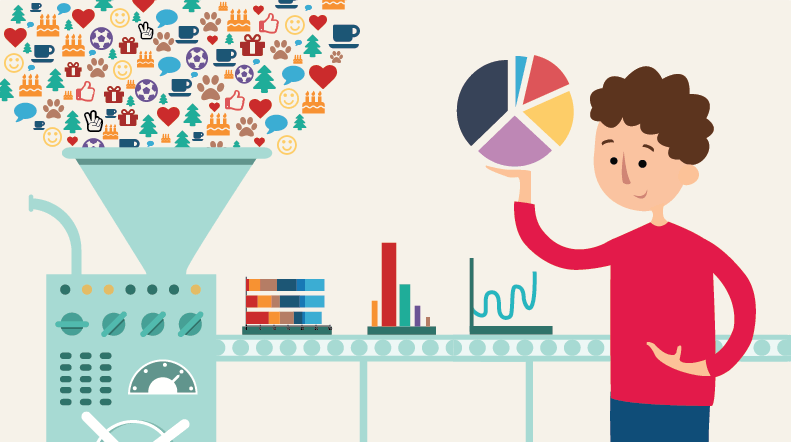
Step 5: Data collection– Same data from different sheets are combined to remove the extra space.
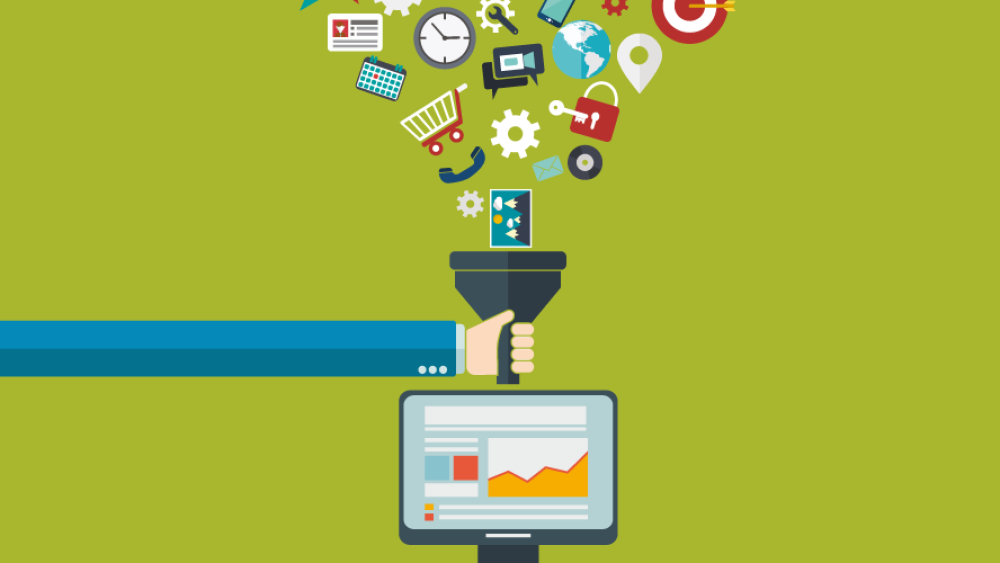
Stage 6: Data scanning– Here comes the role of logical and mathematical tools. Now all the data is examined to extract useful information.

Step 7: Perceiving data– The company strategist now puts the data into a graphical and systematic form using tools like Tableau, etc.
Stage 8: Final examination outcome– This is the final step, in which the final report is given to the business stakeholders and owner who can take mandatory steps.
Benefits of the Technology
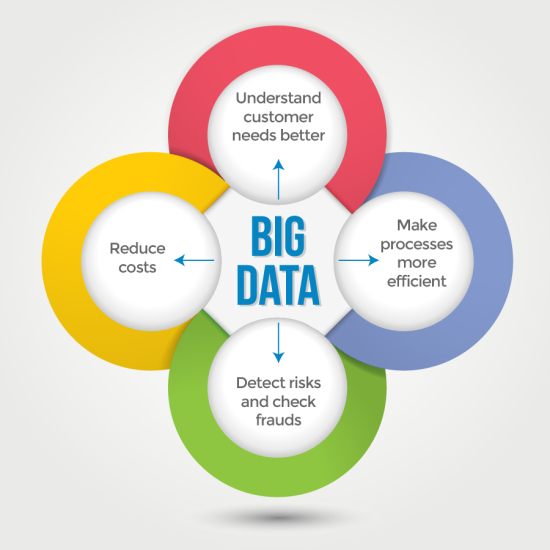
This technology helps organizations and companies to collect the data of their competitors. As to make new strategies to beat the competition. Also, it guides to perform best business moves. Moreover, this can increase the profit and will be more convenient.
More Advantages are as follows:
- Risk management: A banking company in San Nicolas “Banco de Oro” uses this technology to protect their money from fraudulent activities. This bank also reduces fraud activities by analyzing many aspects and finds the root cause.
- Product Development and Innovations: Everyone in the world has heard about “Rolls-Royce”. One of the biggest producers of jet engines, cars, and armed vehicles uses this to find the capacity and capability of their engines. Also, they examine whether any changes are needed or not.
- Quicker and Better Decision Making Within Organizations: Starbucks is one of the popular brands that provide the best quality drinks also uses this to make smart moves to increase their sales. For example, if Starbuck wants to open a new outlet, they will study the location where they can open. They will also examine some different elements like population, landmark, and many more.
- Improve Customer Experience: Delta airlines is a major airline company in the United States that uses these stats to improve its customer experience. This company scan and studies the tweets of all the passengers that traveled in their airlines. Whenever they find any negative tweet related to the staff and journey of the passenger they take necessary steps to solve that issue.
Applications of Big Data Analytics
With the advancement of technology, the demand for data management experts has increased in companies like Software AG, Oracle Corporation, IBM, Microsoft, SAP, and Dell, etc. These companies have spent more than $15 billion on organizations having experience in data analytics and management. In 2010, this industry was having a worth almost $100 billion and was growing at a faster pace with an increment of approximately 10 percent every year. It is almost twice as fast as the software work. Industry specialists, academicians, and many other important contributors accepted that this technology is a big game-changer.
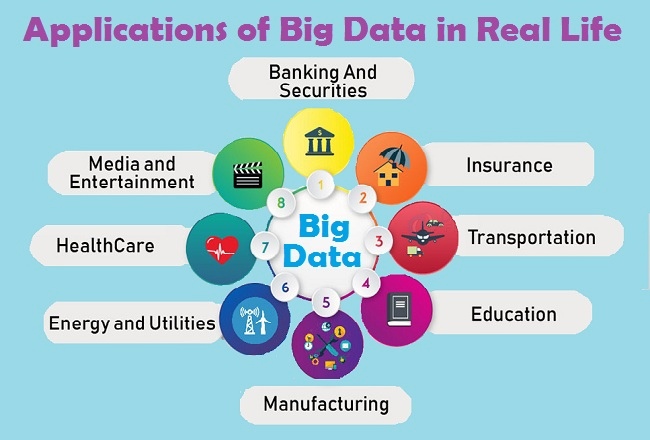
This is the list of the top 10 industries that are using Big Data Analytics:
- Government
- Education
- Healthcare Provider
- Banking and Securities
- Communications, Media and Entertainment
- Manufacturing and Natural Resources
- Insurance
- Retail and Wholesale trade
- Transportation
- Energy and Utilities
Popular Tools for Big Data Analytics
Here is a list of tools that are useful in big data analytics:
- Hadoop- This tool helps in reserving and studying information.
- MongoDB- It is used on datasets that change constantly.
- Talend- It is helpful in data combining and controlling.
- Cassandra– It is an assigned database use to manage chunks of data.
- Spark– It is helpful in immediate changing and studying a large quantity of information.
- STORM– This is an open-source actual computing arrangement.
- Kafka– This is a distributed running program that keeps fault-tolerant data.
Conclusion:
This was the brief intro about BDA, which can help in the improvement of multiple real-life sectors. The process of BDA is similar to those of Data Science and Machine Learning, the only difference here is that we get data from multiple sources and in huge amounts.
Hope this article gave you a head start in order to go deeper into the concept of Big Data Analytics.
Thanks for reading this article do like if you have learned something new, feel free to comment See you next time !!! ❤️
References
- Image 1 – https://www.workflowmax.com
- Image 2 – https://www.eff.org/
- Image 3 – https://www.linkedin.com
- Image 4 -https://analyticsindiamag.com
- Image 5- https://medium.com
- Image 6- https://www.shutterstock.com
- Image 7- https://tdwi.org
- Image 8- https://www.promptcloud.com
- Image 9- https://www.scientificworldinfo.com


