This article was published as a part of the Data Science Blogathon.
Introduction
With technological evolution, data dependence is increasing much faster. Gone are the days when business decisions were primarily based on gut feeling or intuition. Organizations are now employing data-driven approaches all over the world. One of the most widely used data applications is ‘Predictive Analytics’. Predictive analytics is widely used for solving real-time problems, be it forecasting the weather of a place or predicting the future scope of a business.
Definition of Predictive Analytics
“Predictive Analytics refers to the field that applies various quantitative methods on data to make real-time predictions.”
It provides a method of approaching and solving problems using various technologies, essentially machine learning. Predictive Analytics often makes use of machine learning algorithms and techniques to build models that make predictions.
Tools needed to begin: Python programming, Numpy, Pandas, Matplolib, Seaborn, Scikit-Learn
Predictive Analytics: Steps

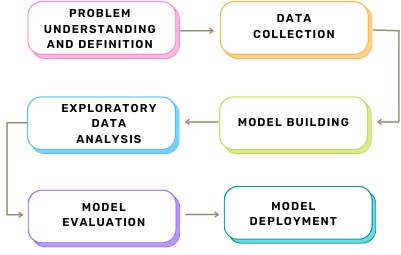
Figure 1: The Predictive Analytics Process
(1) Problem Understanding and Definition:
This is the initial stage in the process of predictive analysis. This is a vital stage because we first need to understand what exactly the problem is to frame the solution. When a stakeholder approaches you with a certain problem, the first step would be to know the stakeholders’ requirements, the utilities available, the deliverables and finally, know how the solution looks from the business perspective.
Sometimes the requirements of the stakeholders may not be clearly defined. It becomes our responsibility to understand precisely what is to be predicted and whether the outcome solves the defined problem. The dynamics of the solution and the outcome completely change based on the problem definition.
Converting a business problem into an analytical one is the most important part of predictive analysis. Hence explicitly define what is to be predicted and how does the outcome look like.
(2) Data Collection:
This is the most time-consuming stage. Sometimes, the required data may be provided by the stakeholder, from an external database or in some cases, you may have to extract the data. It is possible that the data so collected may not be sufficient for framing the solution. You may have to collect data from many sources. Think about how much access you have to the dataset that is required.
Since the outcome of the predictive model relies entirely on the data used, it is important to gather the most relevant data that aligns with the problem requirements. Here are a few things to be kept in mind while searching for a dataset:
- Format of the data
- Period across which the data is collected
- The attributes of the dataset
- Does the dataset meet your requirements?
(3) Exploratory Data Analysis:
Once you have the dataset ready, you now may be willing to build your predictive model. But before we start, it is crucial to know the properties of your data. Understanding the kind of data you have, the features it possesses, the target or outcome variable, and the correlation among these features all play a role in designing a suitable model. The main aim of EDA is to understand the data. This may be achieved by answering the below few questions:
- What are the data types present in the dataset?
- What is the dimensionality of the dataset?
- What does the data distribution look like?
- Is there any missing data?
- Is there any prominent pattern in the data distribution?
- Do you observe outliers?
- How are data features correlated to each other?
- Does their correlation affect the outcome?
Sometimes the data collected contains a lot of redundant data. If such data is fed as input to the model, there is a high possibility that the model makes wrong predictions. Hence it is important to perform EDA on the data to ensure that all the outliers, null values and other unnecessary elements are identified and treated. Identifying the patterns in the data makes it easier to decide the model’s parameters. EDA helps us improve the model’s accuracy even before it is built.
EDA generally has two components- numerical calculations and data visualizations. Calculating Standard Deviation, Z-score, Inter-Quartile Range, Mean, Median, Mode, and identifying the skewness in the data are some ways of understanding the dispersion of data across the dataset. Graphical representations such as heat maps, scatter plots, bar graphs, and box plots help get a wider view of the dataset.
(4) Model Building:
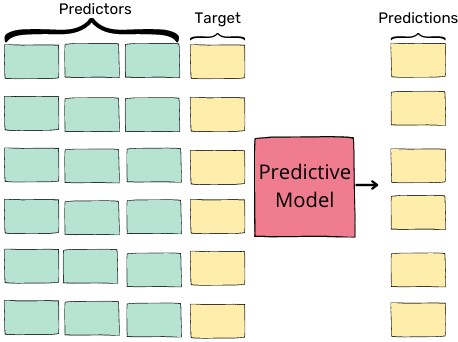
After applying EDA, it is finally time to build predictive models using machine learning. In the dataset, we use the predictor variables to make predictions on the target variable.
Target: The dependent variable whose values are to be predicted.
Predictors: The independent attributes in the dataset that are used to predict the value of the target variable. Once the target is identified, all other columns become the predictor variables.

Figure 2: Model Building
Here we consider the model a calculator that takes in inputs and gives out the predicted output. We may have to build a Regression or a Classification model based on the problem.
Regression algorithms such as Simple Linear Regression, Multi Linear Regression, Decision Tree Regression etc., may be used to get desired results. Such models are used when the target is a numeric feature.
Example: Predicting the house prices
While classification models are used when the target is a categorical feature, the classification problems may be a binary classification or multiclass classification.
Binary classification: The target has only two possible categories.
Multiclass classification: The target has more than two possible outcome categories.
Apart from these, unsupervised learning algorithms such as Clustering and Association algorithms can also be used based on the requirement.
(5) Model Evaluation:
Once the model is built, the next stage would be to analyze the performance of the model. Evaluating the model based on different scenarios and parameters thereby contributes to deciding ‘the most effective’ model for solving the given problem. Usually, one or more metrics are used to know how good the model performs.
Different measures are used for rating the performance of machine learning models.
For regression models: Mean Squared Error (MSE), Root Mean Squared Error (RMSE), R Squared (R2 Score)
For classification models: F2 Score, Confusion Matrix, Precision, Recall, AUC-ROC
(6) Model Deployment:
Now that the model has been built, tested and evaluated, it is time to deliver it to the stakeholder. Model deployment involves placing the model into a real-world application that can be used for its intended purpose. This may be done by using the model in a software application, integrating it into a hardware device, building a framework around the model or using the model itself as a ‘data product’.
Conclusion
This article taught us the primary steps of predictive analytics. One needs to be aware of these while dealing with predictive analytics problems.
- Framing and understanding the problem statement
- Collecting and preparing the data
- Build appropriate models
- Evaluate them to choose the best one
- Deploy them in the required format
However, these were just an overview of the most important stages; further steps can also be performed depending on the problem.
Now that you have a basic understanding of how prediction models are designed, you can start learning the tools and concepts required to build your first prediction model.
The media shown in this article is not owned by Analytics Vidhya and is used at the Author’s discretion.


