This article was published as a part of the Data Science Blogathon.
Introduction
Each individual is different and so are his preferences. With such a diversity of needs and preferences, how do you serve all of them? Most importantly, how as a business do you know which customers to target and form the right marketing strategies for each of them? In this customer-centric world, Segmentation is your answer.
In this article, we shall explore what is customer profiling, how to build it in Python, and what interpretations to make of it.
What is Profiling?
Profiling means how do the segments differentiate each other based on the KPI’s (or variables). For instance, what is the average income of each segment, and then on comparing the segments, can understand one group has a high income, another group has low income. This way can see that the groups are getting differentiated on the basis of income or income is segregating the segments.
The steps to perform profiling are as follows:
- Find the count of each segment which gives how many observations or records are present in each of the segments.
- Find the overall average and the individual segment-wise average for each of the attributes.
- To find the best profiling, perform the above two steps for each of the k-values (k = cluster).
Dataset Information
We shall work with Credit Card customer data to implement profiling in Python. The dataset and codes can be accessed from my GitHub repository. The attributes description are:
- CUST_ID: Credit card holder ID
- BALANCE: Monthly average balance (based on daily balance averages)
- BALANCE_FREQUENCY: Ratio of last 12 months with balance
- PURCHASES: Total purchase amount spent during last 12 months
- ONEOFF_PURCHASES: Total amount of one-off purchases
- INSTALLMENTS_PURCHASES: Total amount of installment purchases
- CASH_ADVANCE: Total cash-advance amount
- PURCHASES_ FREQUENCY: Frequency of purchases (Percent of months with at least one purchase)
- ONEOFF_PURCHASES_FREQUENCY: Frequency of one-off-purchases
- PURCHASES_INSTALLMENTS_FREQUENCY: Frequency of installment purchases
- CASH_ADVANCE_ FREQUENCY: Cash-Advance frequency
- AVERAGE_PURCHASE_TRX: Average amount per purchase transaction
- CASH_ADVANCE_TRX: Average amount per cash-advance transaction
- PURCHASES_TRX: Average amount per purchase transaction
- CREDIT_LIMIT: Credit limit
- PAYMENTS: Total payments (due amount paid by the customer to decrease their statement balance) in the period
- MINIMUM_PAYMENTS: Total minimum payments due in the period.
- PRC_FULL_PAYMEN: Percentage of months with full payment of the due statement balance
- TENURE: Number of months as a customer
After all the preprocessing steps, building new KPIs, and derived variables (had extracted new feature of the type of purchases done by each customer), the dataset looks like below:
Hit Run to see the output
Using the K-Means and Agglomerative clustering techniques have found multiple solutions from k = 4 to 8, to find the optimal clusters. On performing clustering, it was observed that all the metrics: silhouette score, elbow method, and dendrogram showed that the clusters K = 4 or K = 5 looked very similar so now by using Profiling will find which cluster is the optimal solution and also check the similarities and dissimilarities between the segments.
Step 1:
Firstly, we find the total size of the cluster and then find the break up of the values in each of the respective segments.
So, we obtained how many observations are present in each of the segments. Post which, we sort the segments based on the labels and not the highest value within the segments:

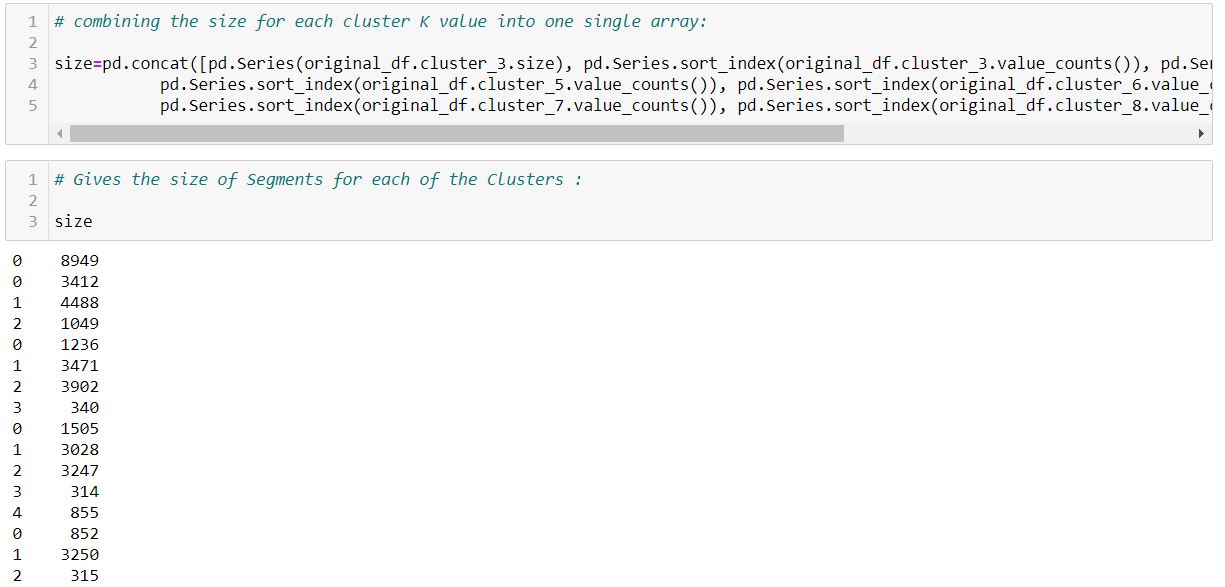
Now, we repeat the above two steps for other clusters, in our case from K = 4 to K = 8, and then combine the result for each cluster K value into one single array:
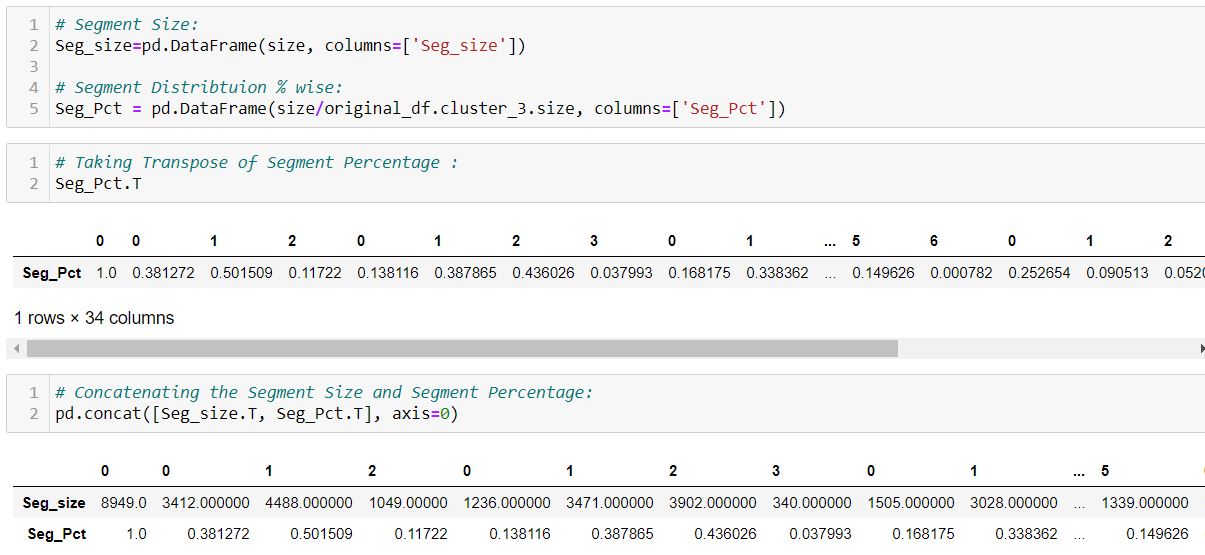
We store the Segment Size and the segment distribution in the respective data frames and concatenate the two outputs:
Step 2:
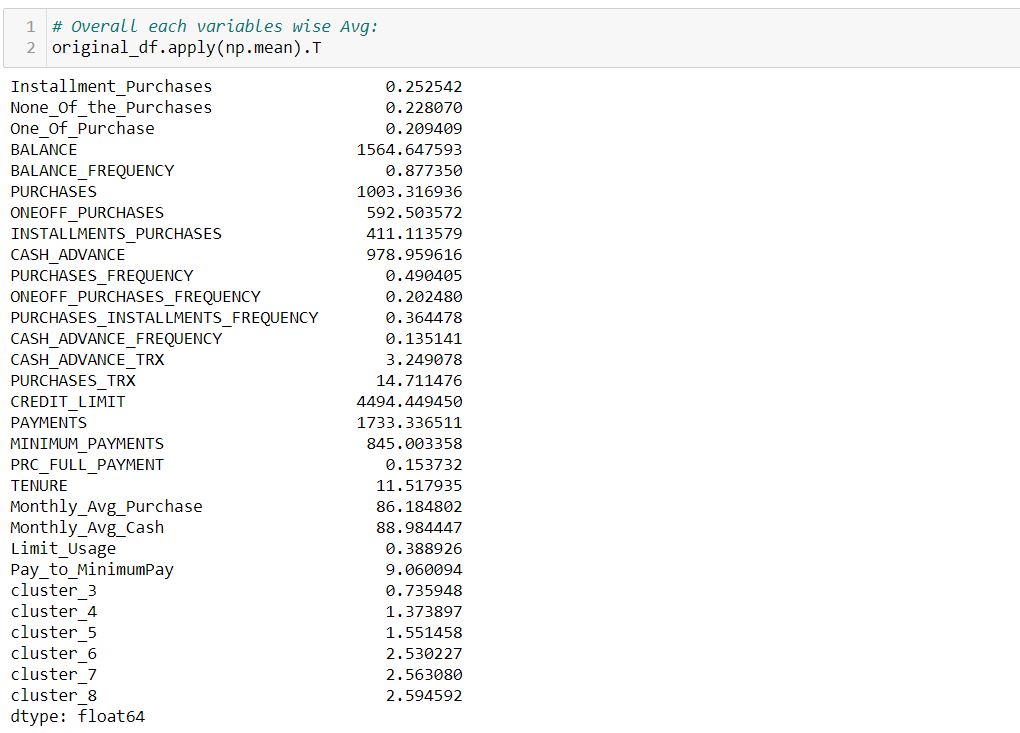
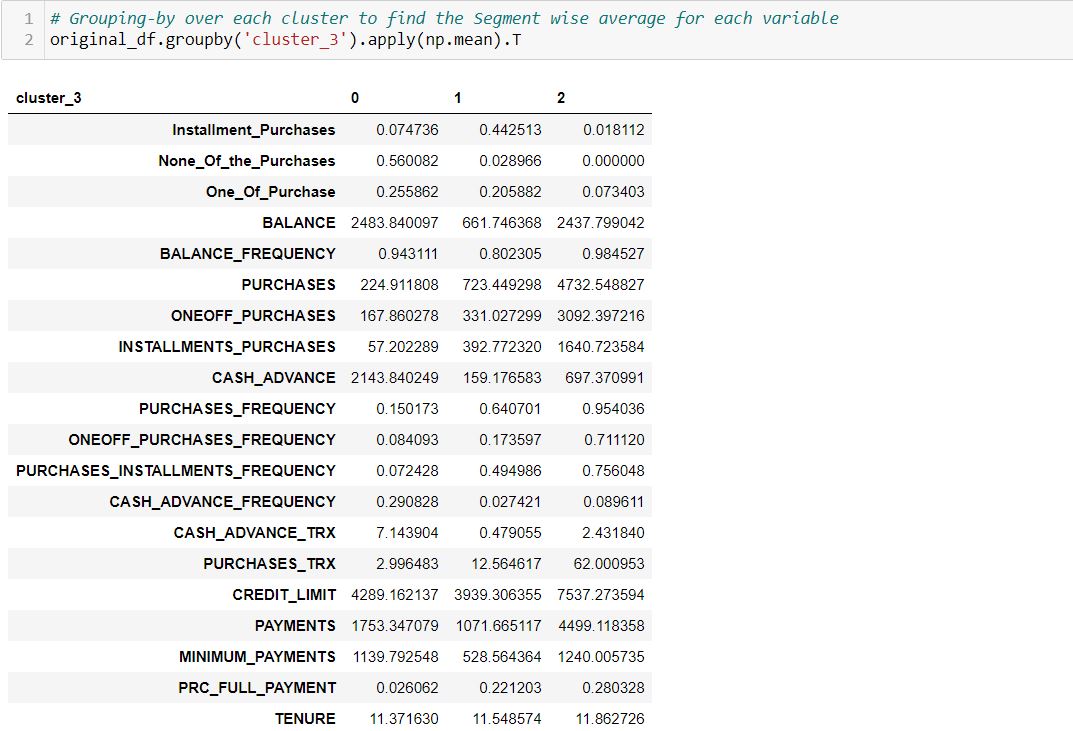
A good indication of the distribution of data is the mean value, hence will find the average value for each of the variables and in each cluster.
Firstly, finding the overall average for each variable:
By grouping over each cluster, we find the Segment wise average for each variable:
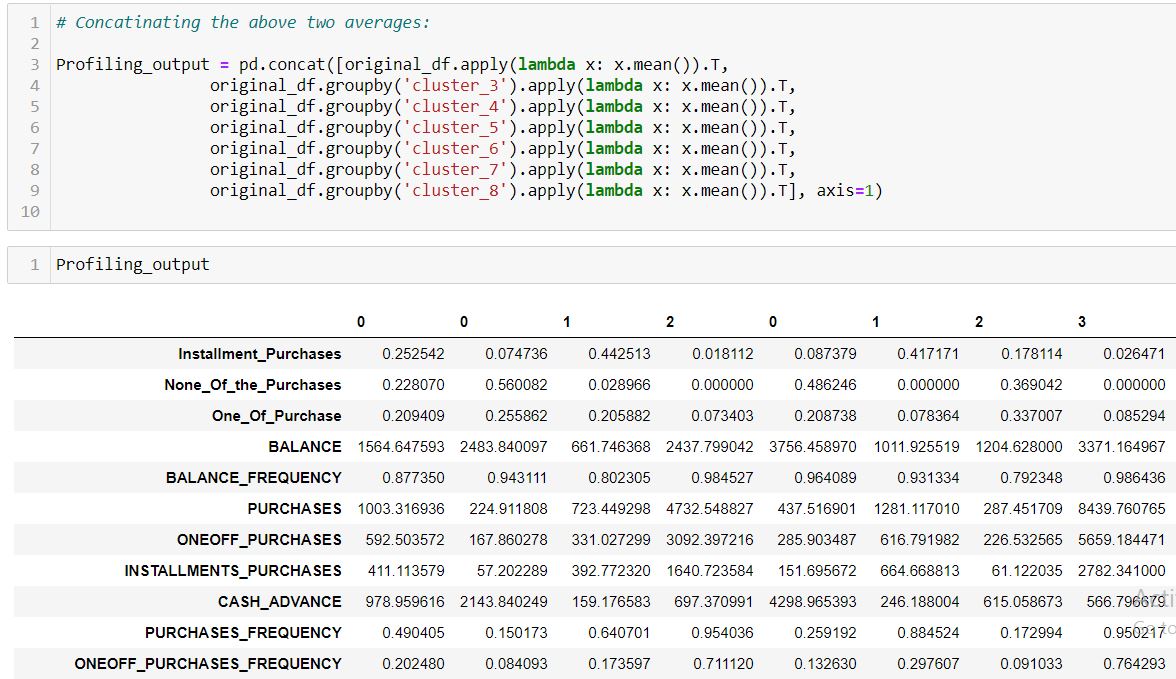
Combining the outputs from steps 1 and 2: concatenating the segment size, segment distribution, the overall averages, and the individual segment-wise average. Also, adding the column names to the above profiling output to increase the readability and for understanding purposes:
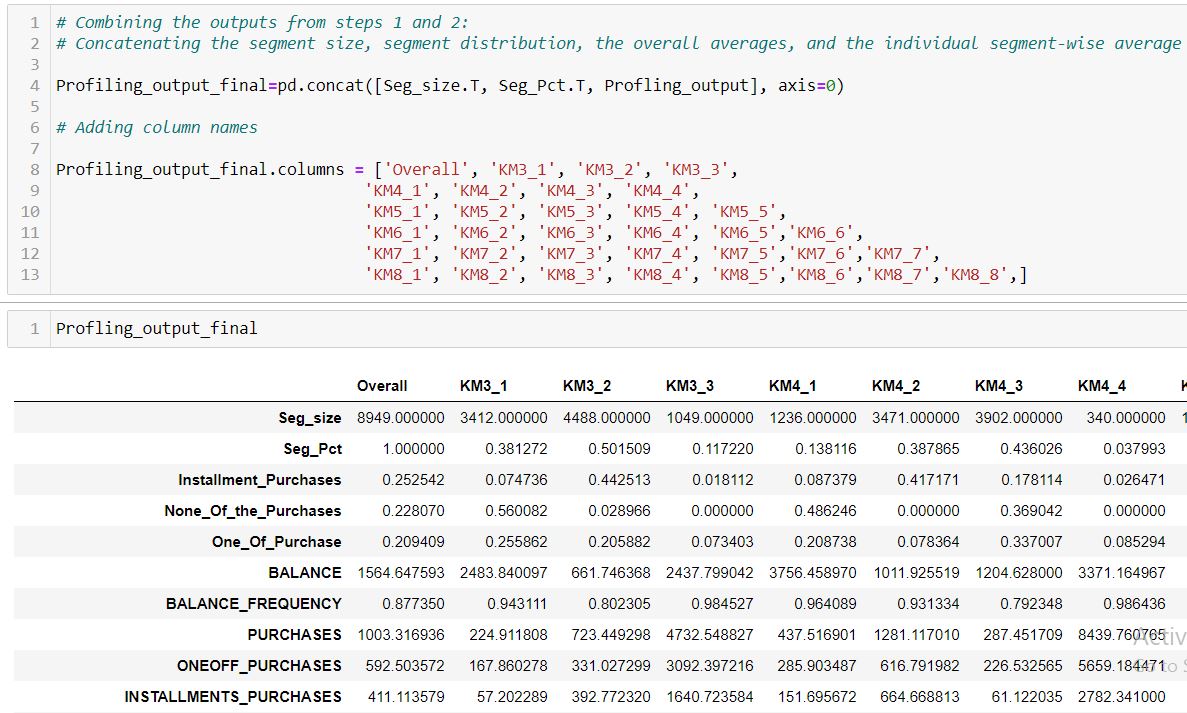
The result we get the overall average and individual segment-wise average for each of the variables.
Output of Profiling
The output of the profiling looks like below:
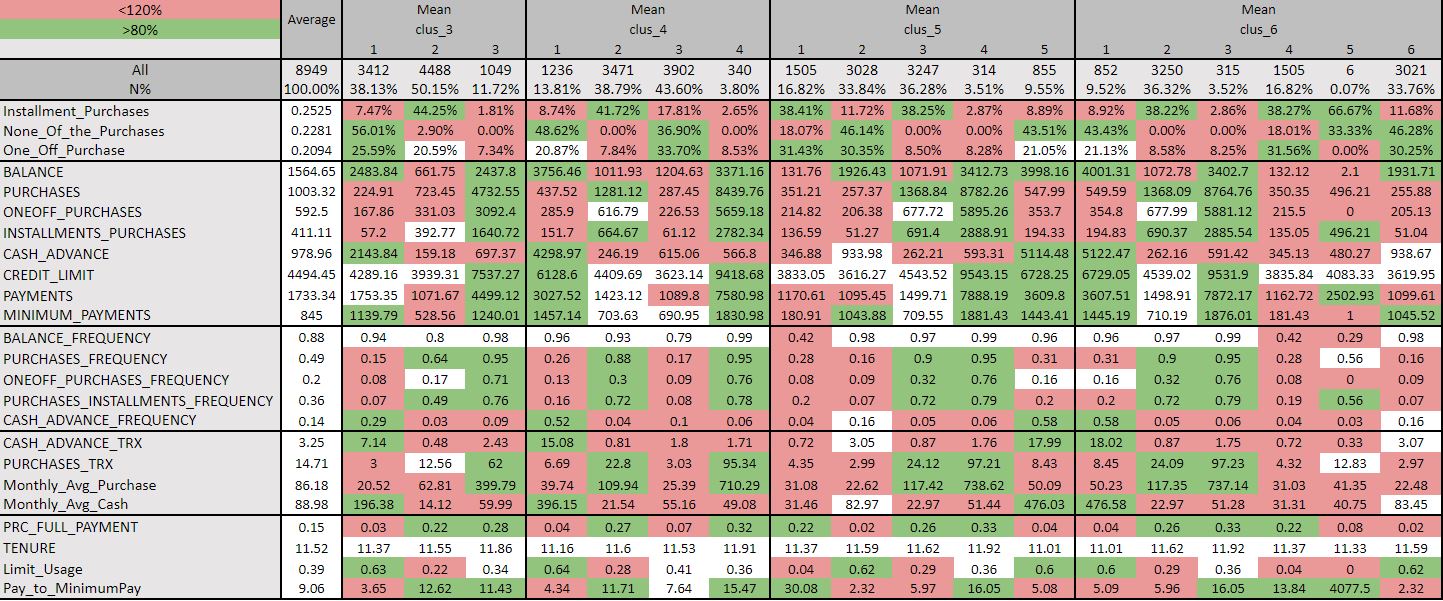
Due to the space constraints, only six clusters are shown above. We will get the output for all the clusters that were initialized at the start. The important aspect is to understand how to read, make use of the above results and characterize the segments.
To make the most of the output of the profiling, we apply conditional formatting to the results obtained. In the second step, we found the overall average and the individual segment-wise average for each of the attributes. We compare the individual-wise segment average with the overall average for each variable. The value having 20% of the average above the overall average is colored in green and the value with 20% of the average below the overall average is colored in red. The rest of the values lying within this range remain the same in white color.
As the dummy variables are binary values where the values are either 1 or 0 then the result in performing profiling that is on taking the average of these values is in terms of the percentages. Ideally, the distribution of segments must be closer to 4 to 40%, which makes cluster 3 and clusters more than 5 irrelevant. Now within clusters 4 and 5, we check for which cluster differentiates between the segments with proper distinction and has unique characteristics about them. Looking closely at both clusters 4 and 5.
Inference from Profiling
Cluster 4:
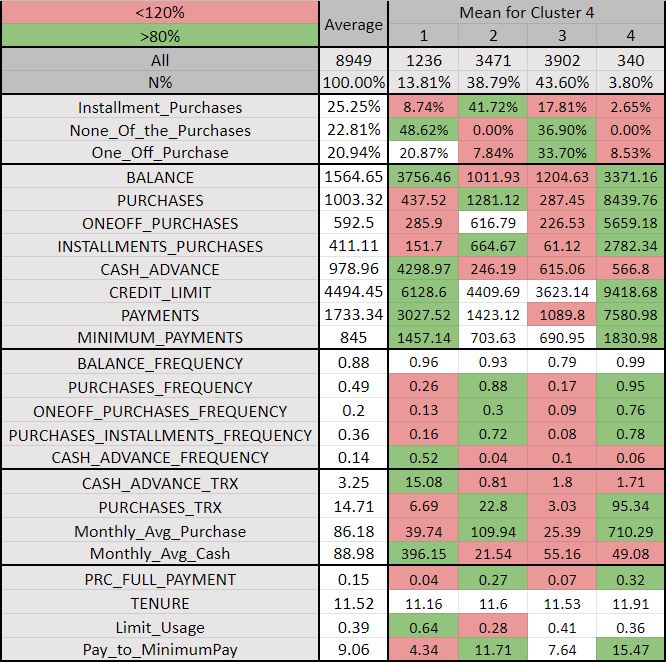
Cluster 5:
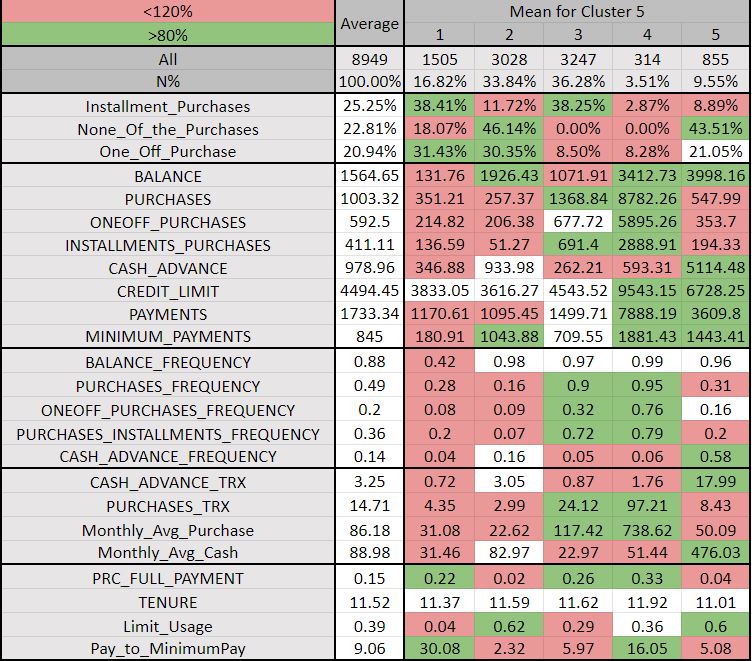
Both clusters 4 and 5 looks almost similar, however, there is some distinction between the two. On further analyzing cluster 5 we can observe the following:
In Segment 1, the customers make more one-off purchases than installment purchases. The amount of the purchases, the amount spent per transaction are very low. The balance amount to pay, cash advance, and its respective amount are also very less. They can be categorized as Beginners.
People in Segment 2 are very risky as they high limit usages meaning they are not carefully managing available credit. They also less frequently make installment purchases. The amount spends per purchase and the monthly spend is very less. They have a low payment ratio.
Segment 4 customers are the best for the business as these people frequently make both the installment and one-off type purchases and that too of very high amount. Their amount spent per purchase is also high. They are less risky as well having a low limit utilization rate and have a very high credit limit. This segment is Big Tickets or the Frequent Purchasers.
Consumers in Segment 5 people rarely make purchases. They have a low frequency of both the types of purchases: installment and one-off purchases. They prefer to make one-off purchases and not installment type. The number of purchases made across the past 12 months is less. The balance amount to be paid is high. These are the Rare Purchasers category.
This is how conditional formatting helps us to differentiate between segments for each cluster to understand the similarities and dissimilarities between the segments.
Post profiling, we found that there are five clusters that give us the best solution. We can segment the customers into five buckets which have the following characteristics as:
- Big Tickets: These are people who make purchases very frequently and also of large amount.
- Medium Tickets: These people prefer to make installment purchases and do frequently purchase.
- Rare Purchasers: People in this group do purchase but rarely. They often make one-off purchases.
- Beginners: These are beginning to purchase yet long to go.
- Risk: These are very rare purchasers indicated by the low amount of purchases made and less frequency of the purchase.
End Notes
- Are the segments differentiating or not. This aspect is more important than Segmentation itself!
- Characteristics of the segments
- How to use these characteristics of the segments for strategizing to solve the business problem.
Thank You.
You may connect with me on Linkedin: linkedin.com/in/neha-seth-69771111
The media shown in this article are not owned by Analytics Vidhya and is used at the Author’s discretion.


