This article was published as a part of the Data Science Blogathon.
Introduction
Pandas’ Python profiling package produces an interactive set of tables and visualizations for exploratory data exploration (EDA). It can be difficult to understand pandas, associated data analysis tools (matplotlib, seaborn, etc.), and all the coding techniques and properties. This is particularly crucial for swiftly gaining data insights.
The Pandas Profiling Library allows you to create dynamic, interactive collections of exploratory data analysis (EDA) tables and visualizations with just a few lines of code. To utilize Pandas profiling, you don’t need to go through a difficult learning curve or have an in-depth understanding of multiple packages.

Panda’s df. describe() function is great but a bit rudimentary for serious exploratory data analysis. pandas_profiling extends pandas DataFrame with df.profile_report() for fast data analysis.
Helps create profile reports for Pandas DataFrames
Exploratory Data Analysis
An exploratory data analysis is a strategy to investigate and analyze data sets to gather knowledge visually. EDA is used to comprehend a dataset’s important aspects.
Values, counts, means, medians, quartiles, data distributions, correlations between variables, data kinds, data models, and other information are all found with the aid of EDA. EDA takes a lot of time and calls for numerous lines.
Pandas Profiling is a Python package that can be used to automate EDA. It’s a fantastic tool for making interactive HTML reports that simplify data interpretation and analysis.
Installing Profiling Pandas in Different Ways
Let’s explore Pandas Profiling. Using just one line of code, EDA runs very quickly.
Option 1: Using pip
Install the panda’s profile using the pip package installer if Python is operating on your computer independently. Run the following command in cmd (Windows) or terminal (Mac):
pip install pandas-profiling[notebook]
Pip’s installation covers everything you need. After running pip install, you will see several packages like pandas, client notebook, seaborn, etc. Everything required to produce a profile report is also included.
Option 2: GitHub
Alternatively, you can download the most recent version straight from GitHub.
pip install https://github.com/ydataai/pandas-profiling/archive/master.zip
Option 3: Using Conda
Install the pandas profile library via the conda package installation process if you decide to install the Anaconda package to use Python. Run the following commands in the Anaconda terminal:
conda install -c conda-forge pandas-profiling
With conda, everything you need is installed.
Option 4: From Source
Cloning the repository or pressing the button to download the source code ‘Download ZIP’ on this page.
Go to the directory of your choice and install it by running:
python setup.py install
Note: The pandas profiling library is based on pandas, so the version must match the pandas version used by the pandas profiling library. If you have an older version of Pandas installed, the Pandas profiling may cause an error. Update your current pandas installation to the newest version as a workaround in this situation. To force the current pandas to update, return to the console and provide the following command.
pip install --upgrade --force-reinstall pandas
Now your pandas version is up to date
A Case Study on Google Colab
Pandas Profiling Reports – “Basic Building blocks.”
To say that the output of the Pandas profiling library is simple would be an understatement. Alternatively, you can use the following code to construct a general output called a profile report.
To generate a profile report:
- Import pandas
- Import ProfileReport from pandas_profiling library
- Create DataFrame with data for the report
- Pass DataFrame using ProfileReport()
Installing the Library – Pandas Profiling
pip install https://github.com/ydataai/pandas-profiling/archive/master.zip
Importing Basic Libraries for Numerical, Visual Data Manipulation
import pandas as pd
 import matplotlib.pyplot as plt
 from pandas_profiling import ProfileReport
 pd.set_option('display.max_colwidth',None)
 %matplotlib inline
Reading the Excel Data using pandas
df=pd.read_excel('GA NMU.xlsx')
Why Profiling reports are useful
Reports on profiling are completely editable. The next piece of code loads a navigation configuration that includes numerous features for text (length distribution, Unicode data), files (file size, creation time), and images (dimensions, exif information).
Utilizing iframe() to set up a frame inside the window ()
profile.to_notebook_iframe()
Sample output with running query
Saving the Output in HTML format
profile.to_file(output_file='Pandas ProfilingReport.html')
For each column, the following statistics – if relevant for the column type – are presented in an interactive HTML report:
- Type inference: detect the types of columns in a data frame.
- Essentials: type, unique values, missing values
- Quantile statistics like minimum value, Q1, median, Q3, maximum, range, interquartile range
- Descriptive statistics like mean, mode, standard deviation, sum, median absolute deviation, coefficient of variation, kurtosis, skewness
- Most frequent values
- Histogram
- Correlations highlighting highly correlated variables, Spearman, Pearson, and Kendall matrices
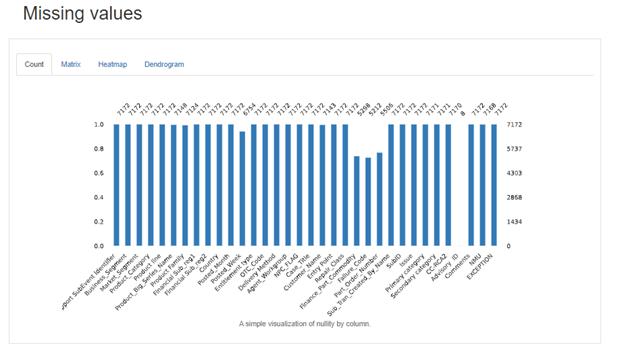
- Missing values matrix, count, heatmap, and dendrogram of missing values
- Text analysis learns about text data blocks (ASCII), scripts (Latin, Cyrillic), and categories (Uppercase, Space).
- File and Image analysis extract file sizes, creation dates, and dimensions and scan for truncated images or those containing EXIF information.
Several Segments are Available in the Pandas Profiling Report
Overview:
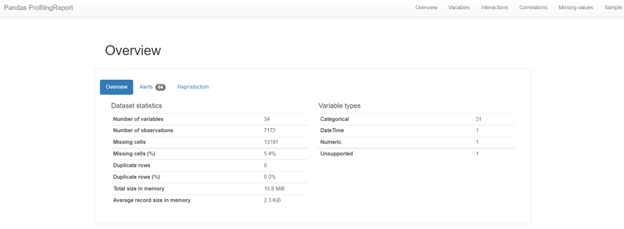
A portion of the more than five pages of data and visualizations are shown above. This is a rudimentary implementation, as was already stated. The report’s title was the only optional addition (not shown in the image above). The Toggle Details widget is visible. A list of specific details is displayed when a user taps the widget (button).
- General information is provided in this section. Variable kinds and data statistics.
- Record statistics display columns, rows, missing values, etc.
- The variable type indicates the data type of the record property. A “warning” that lists the functions with a strong link to other functions is also displayed.
Variable Section:
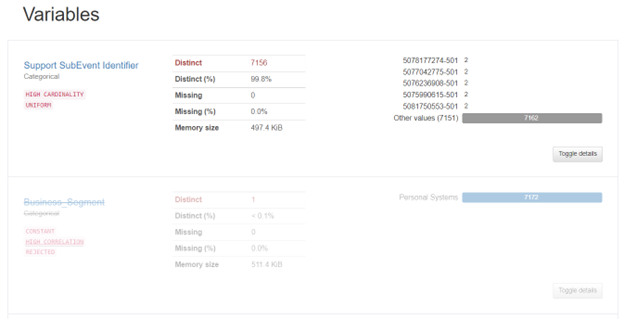
Detailed information is provided in this section for each feature individually. When you select the Toggle Details option, as indicated in the aforementioned image, a new section will be displayed.
Interactions:
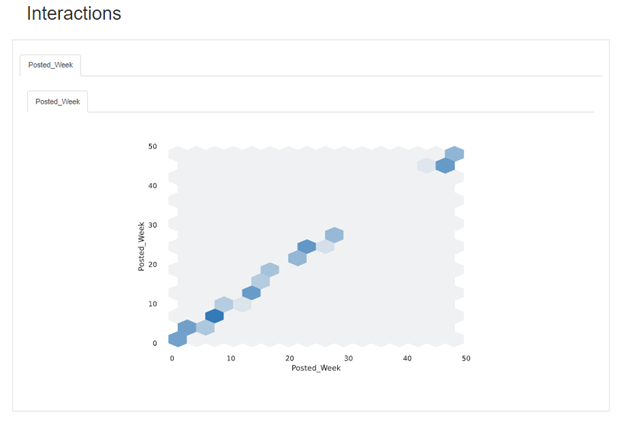
Co-relations:
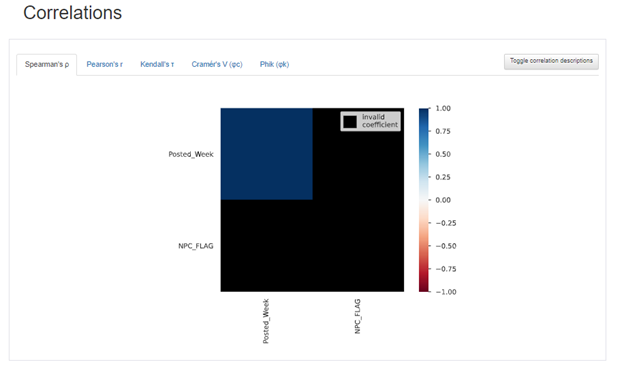
The Seaborn heatmap is used in this section to illustrate how the features are related. Change between various correlations, including Pearson, Spearman, and Kendall matrices, easily.
Missing Values:
Sample:
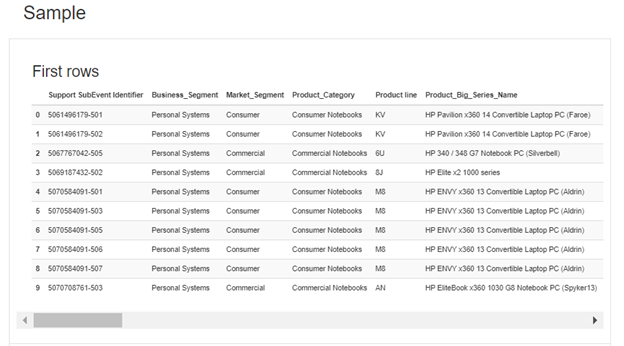
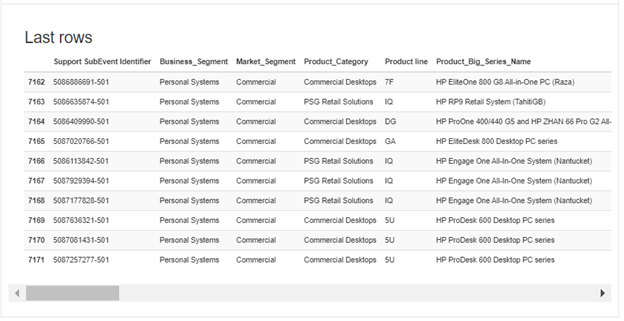
This section displays the First 10 Rows and the Last 10 rows of the dataset.
Profiling Report for Pandas: Advanced Options
Numerous options and sophisticated parameters are available in the pandas profiling report. The visual output of a report and the specifics of each chart and visualization are all controlled by settings.
There are several optional
settings you should know
- title: The title attribute sets the title of the report. This optional attribute is set when the profile report is created. An example is shown in the third line of code above.
- to_file(): The profile report is produced as an HTML file that may be stored outside the Jupyter notebook. The created profile report is an HTML file, so take note of that.
- EX : profile.to_file(“flights_data.html”)
The settings can be used in two different ways. When creating a profile report, the first option applies modifications as extra characteristics using a dictionary. The second choice again defines key-value pairs using a dictionary and navigates to the necessary parameters using dot notation.
There is a minimal view from when Version 2.4 was introduced in the minimal mode for large datasets.
This default setting turns off costly calculations (such as correlation and duplicate).
from pandas_profiling import ProfileReport
profile = ProfileReport(df, minimal=True)
profile.to_file(output_file="output.html")
Conclusion
We hope the Pandas profiling library will help you analyze your data faster and easier. What do you think of this wonderful library? Try it out and let us know about your experience in the answers section.
- Able to process large data sets with minimal visual information.
- This library works great even without serious coding experience.
- Most other IDEs, including PyCharm and Jupyter Notebook, are compatible with Pandas Profiling.
The media shown in this article is not owned by Analytics Vidhya and is used at the Author’s discretion.


