


This article was published as a part of the Data Science Blogathon
Overview:
In this article, we will be learning the theory, types of hypothesis testing. And, we will be taking sample problem statements and solve them using Hypothesis testing.
Table of contents
1. What is Hypothesis Testing and when do we use it?
Hypothesis testing is a part of statistical analysis, where we test the assumptions made regarding a population parameter.
It is generally used when we were to compare:
- a single group with an external standard
- two or more groups with each other
Note: Don’t be confused between the terms Parameter and Satistic.
A Parameter is a number that describes the data from the population whereas, a Statistic is a number that describes the data from a sample.
Before moving any further, it is important to know the terminology used.
2. Terminology used
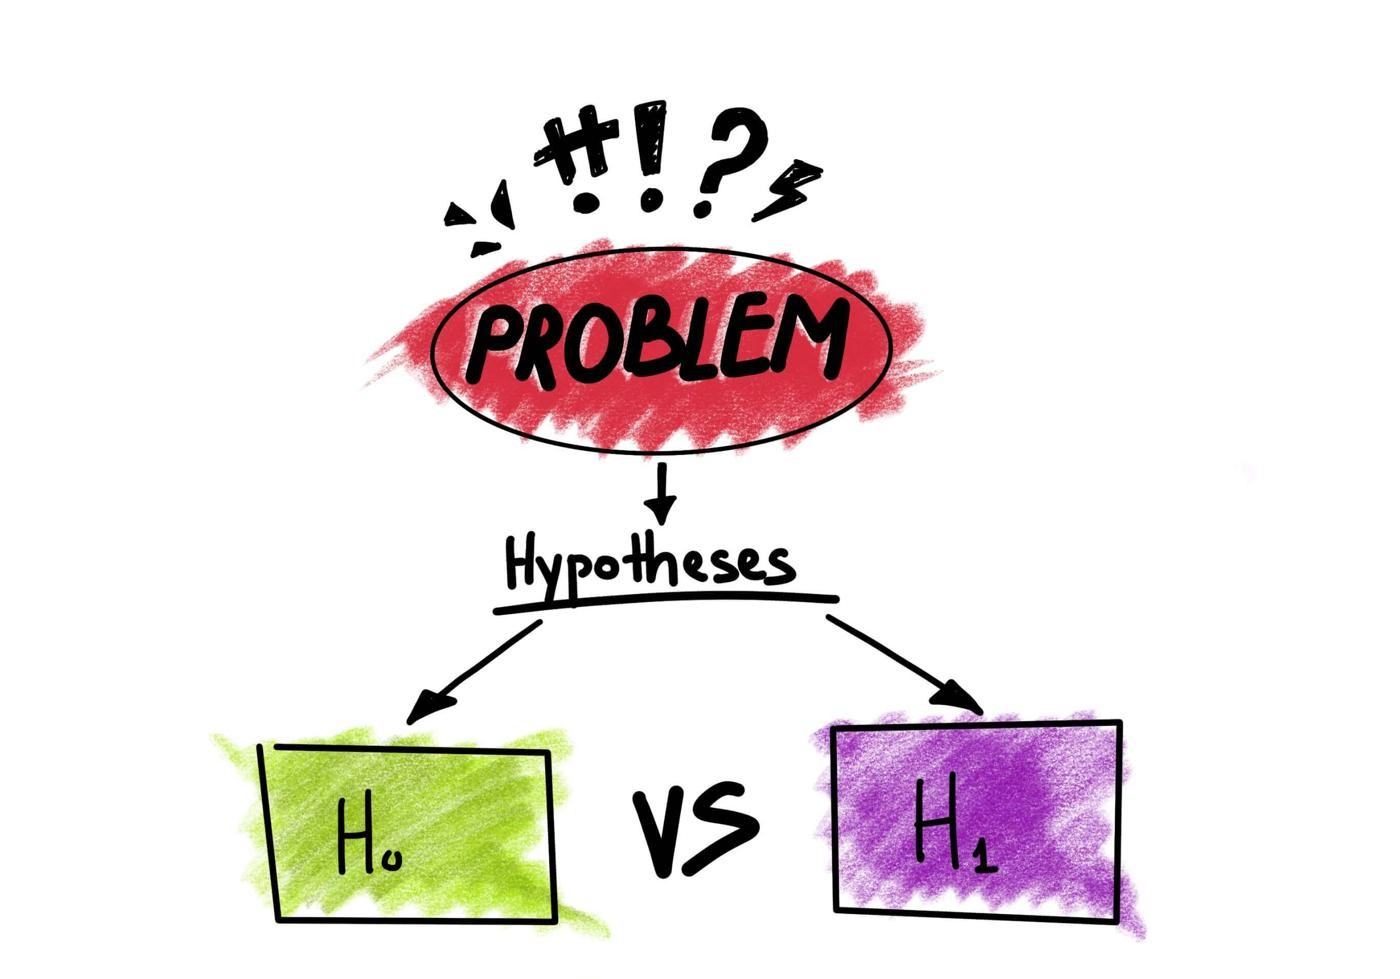
Null Hypothesis: Null hypothesis is a statistical theory that suggests there is no statistical significance exists between the populations.
It is denoted by H0 and read as H-naught.
Alternative Hypothesis: An Alternative hypothesis suggests there is a significant difference between the population parameters. It could be greater or smaller. Basically, it is the contrast of the Null Hypothesis.
It is denoted by Ha or H1.
Note: H0 must always contain equality(=). Ha always contains difference(≠, >, <).
For example, if we were to test the equality of average means (µ) of two groups:
for a two-tailed test, we define H0: µ1 = µ2 and Ha: µ1≠µ2
for a one-tailed test, we define H0: µ1 = µ2 and Ha: µ1 > µ2 or Ha: µ1 < µ2
Level of significance: Denoted by alpha or α. It is a fixed probability of wrongly rejecting a True Null Hypothesis. For example, if α=5%, that means we are okay to take a 5% risk and conclude there exists a difference when there is no actual difference.
Critical Value: Denoted by C and it is a value in the distribution beyond which leads to the rejection of the Null Hypothesis. It is compared to the test statistic.
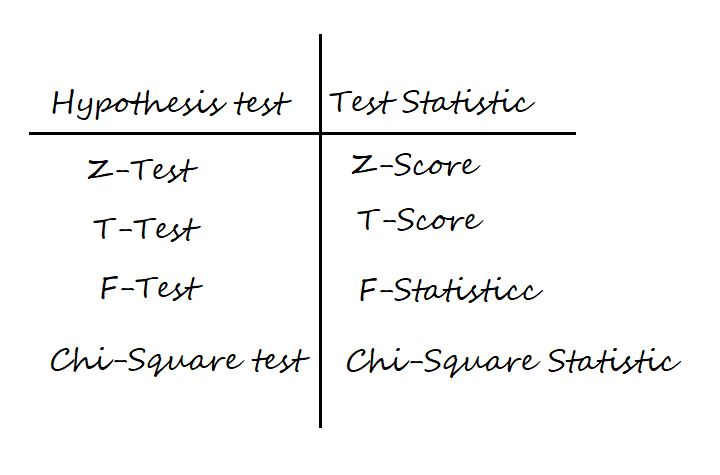
Test Statistic: It is denoted by t and is dependent on the test that we run. It is deciding factor to reject or accept Null Hypothesis.
The four main test statistics are given in the below table:
p-value: It is the proportion of samples (assuming the Null Hypothesis is true) that would be as extreme as the test statistic. It is denoted by the letter p.
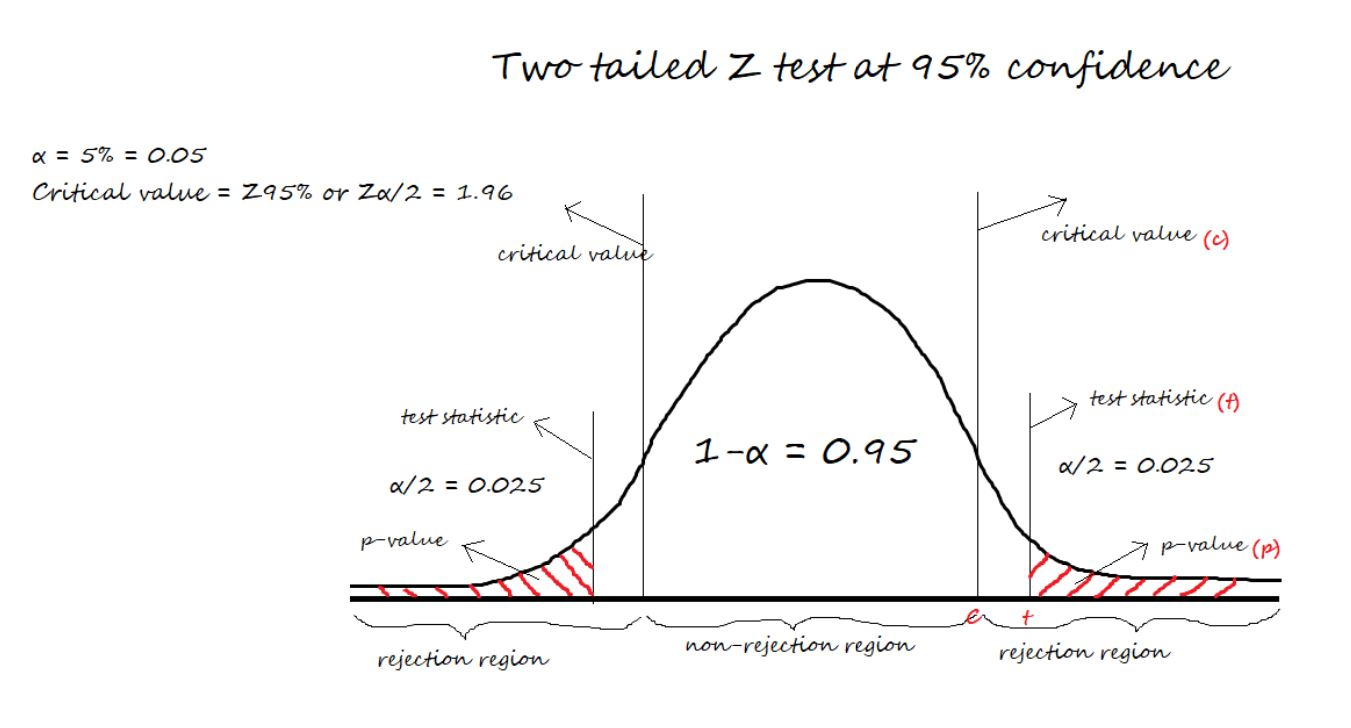
Now, assume we are running a two-tailed Z-Test at 95% confidence. Then, the level of significance (α) = 5% = 0.05. Thus, we will have (1-α) = 0.95 proportion of data at the center, and α = 0.05 proportion will be equally shared to the two tails. Each tail will have (α/2) = 0.025 proportion of data.
The critical value i.e., Z95% or Zα/2 = 1.96 is calculated from the Z-scores table.
Now, take a look at the below figure for a better understanding of critical value, test-statistic, and p-value.
3. Steps of Hypothesis testing
For a given business problem,
- Start with specifying Null and Alternative Hypotheses about a population parameter
- Set the level of significance (α)
- Collect Sample data and calculate the Test Statistic and P-value by running a Hypothesis test that well suits our data
- Make Conclusion: Reject or Fail to Reject Null Hypothesis
4. Decision Rules
The two methods of concluding the Hypothesis test are using the Test-statistic value, p-value.
In both methods, we start assuming the Null Hypothesis to be true, and then we reject the Null hypothesis if we find enough evidence.
The decision rule for the Test-statistic method:
if test-statistic (t) > critical Value (C), we reject Null Hypothesis.
If test-statistic (t) ≤ critical value (C), we fail to reject Null Hypothesis.
The decision rule for the p-value method:
if p-value (p) > level of significance (α), we fail to reject Null Hypothesis
if p-value (p) ≤ level of significance (α), we reject Null Hypothesis
In easy terms, we say P High, Null Fly and P low, Null go.
5. Confusion Matrix in Hypothesis testing
To plot a confusion matrix, we can take actual values in columns and predicted values in rows or vice versa.
(I am illustrating by taking actuals in columns and predicted in rows.)
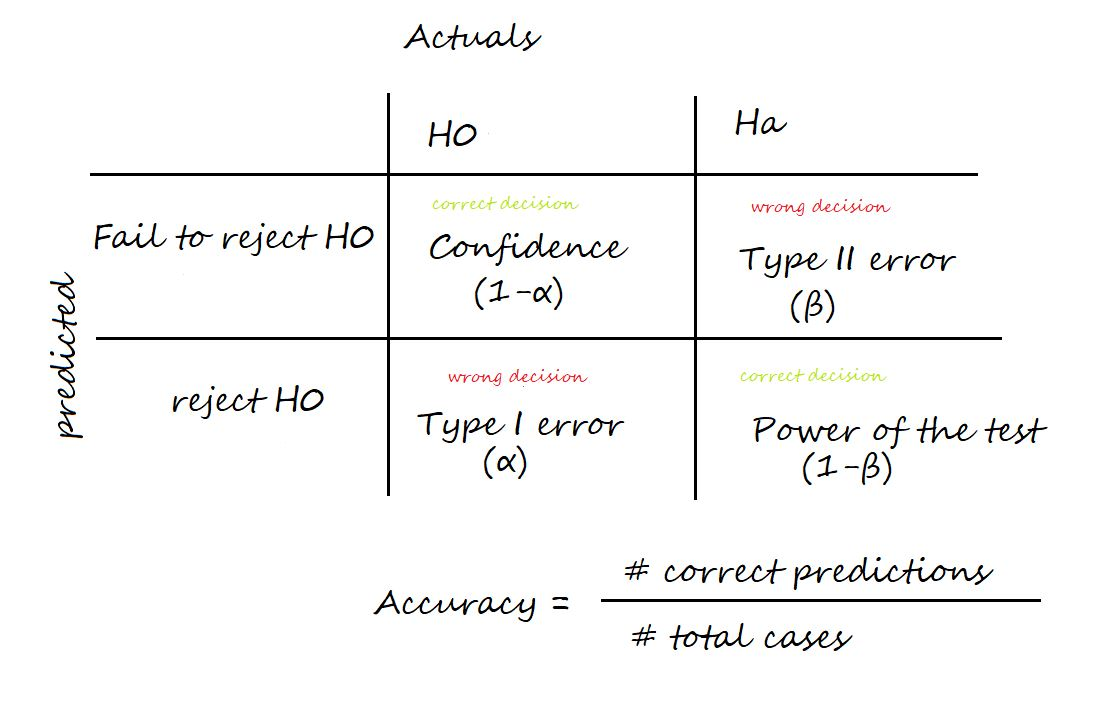
Confidence: The probability of accepting a True Null Hypothesis. It is denoted as (1-α)
Power of test: The probability of rejecting a False Null Hypothesis i.e., the ability of the test to detect a difference. It is denoted as (1-β) and its value lies between 0 and 1.
Type I error: Occurs when we reject a True Null Hypothesis and is denoted as α.
Type II error: Occurs when we accept a False Null Hypothesis and is denoted as β.
Accuracy: Number of correct predictions / Total number of cases
The factors that affect the power of the test are sample size, population variability, and the confidence (α).
Confidence and power of test are directly proportional. Increasing the confidence increases the power of the test.
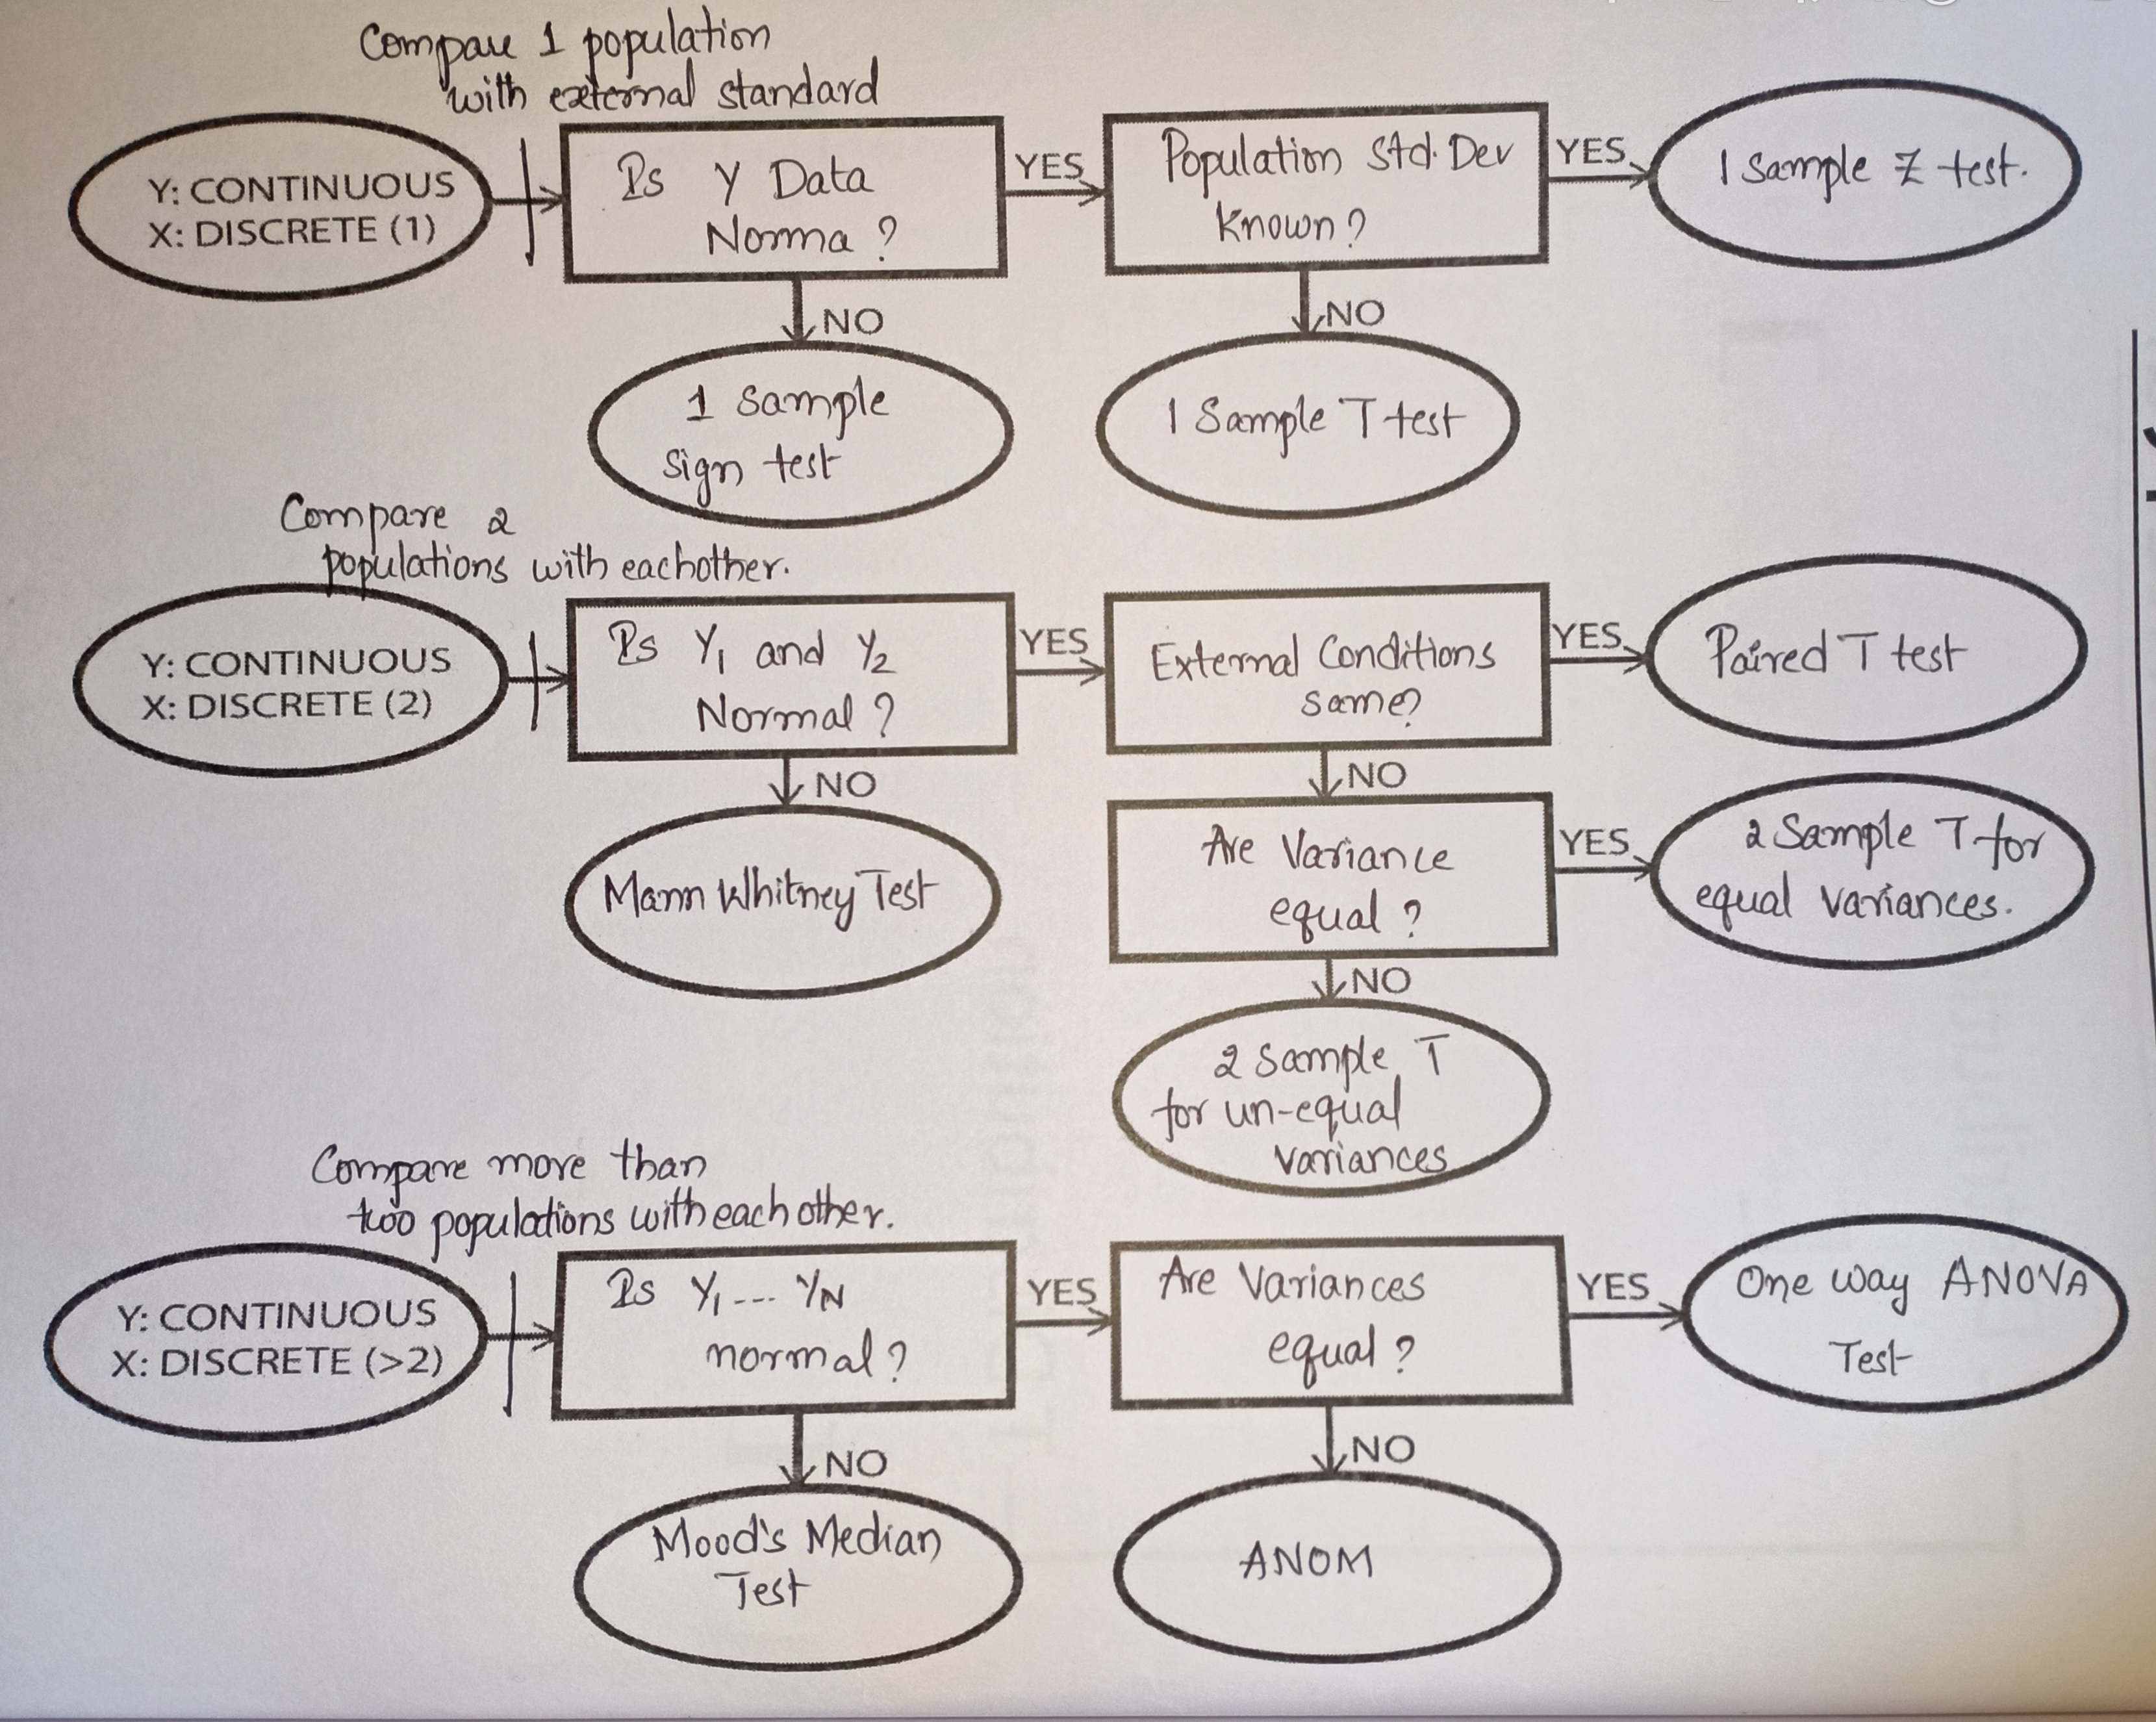
6. Types of Hypothesis Tests
Hypothesis tests when the data is Continuous.
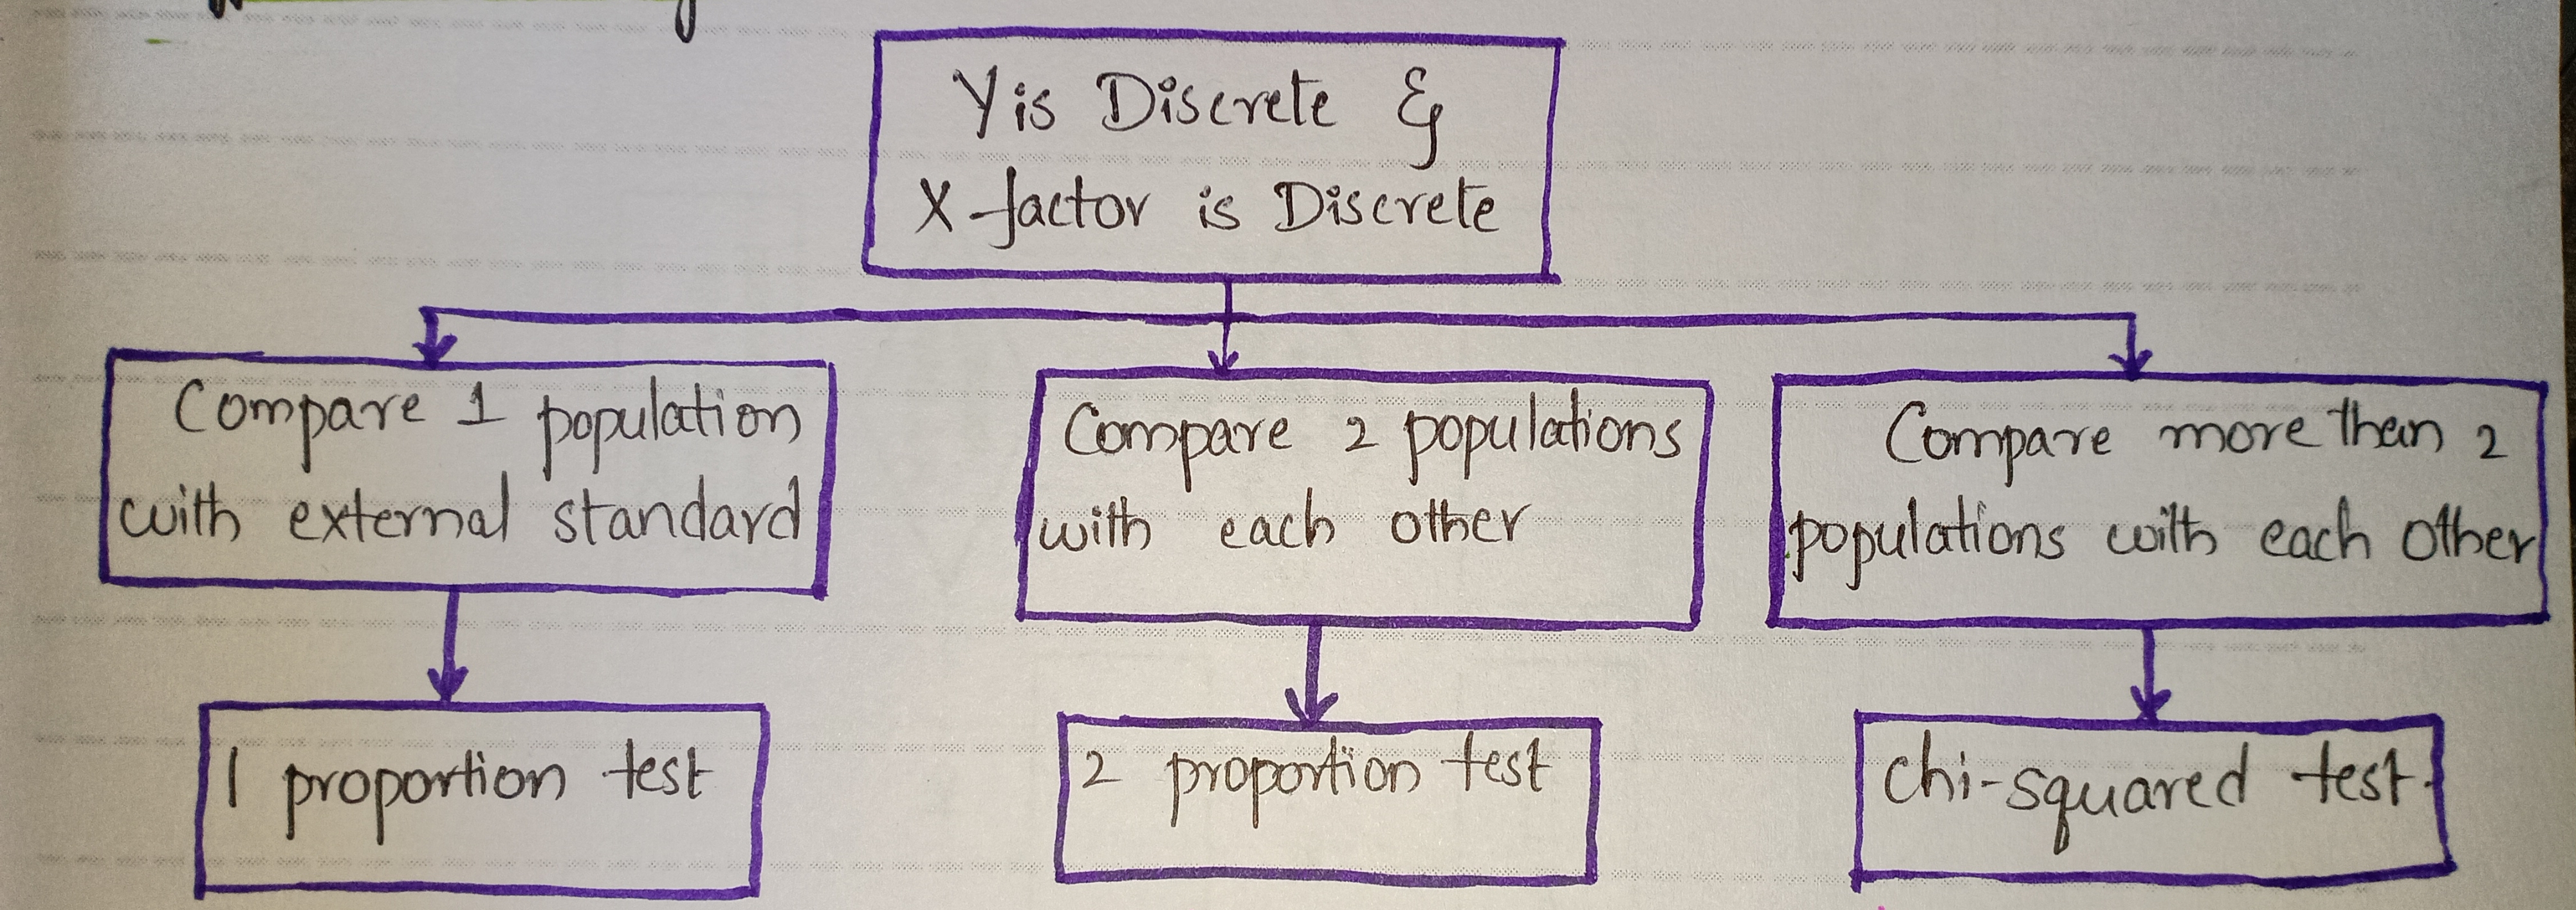
Hypothesis tests when the data is Discrete.
7. Problem-solving
Example 1:
Problem statement: Assume we are pizza makers and we are interested to check if the diameter of the Pizza follows a Normal/Gaussian distribution?
Step 1: Collect Data
import pandas as pd
data = pd.read_csv('diameter.csv')
Step 2: Define Null and Alternative Hypotheses
H0 = 'Data is normal'
Ha = 'Data is not normal'
Step 2: Set the level of significance (α) = 5%
alpha = 0.05
Step 3: Run a test to check the normality
I am using the Shapiro test to check the normality.
from scipy.stats import shapiro
p = round(shapiro(data)[1], 2)
Step 4: Conclude using the p-value from step 3
if p > alpha:
    print(f"{p} > {alpha}. We fail to reject Null Hypothesis. {H0}")
else:
	print(f"{p} <= {alpha}. We reject Null Hypothesis. {Ha}")
The above code outputs “0.52 > 0.05. We fail to reject Null Hypothesis. Data is Normal.“
Example 2:
Problem statement:
Assume our business has two units that make pizzas. Check if there is any significant difference in the average diameter of pizzas between the two making units.
Before reading further, take a minute and think which test would work??? Now proceed further, and check if your answer is right.
Diameter is continuous data and we are comparing the data from two units
Y: Continuous, X: Discrete (2)
Now, go back to the image of Hypothesis tests for continuous data.
The possible tests are Mann Whitney Test, Paired T-test, 2 Sample T-test for equal variances, and 2 Sample T-test for un-equal variances.
Step 1: Check if the data is normal
import pandas as pd
pizzas = pd.read_csv('pizzas.csv')
alpha = 0.05
# Defining Null and Alternative Hypotheses
H0 = 'data is Normally distributed'
Ha = 'data is not Normally distributed'
from scipy.stats import shapiro
def check_normality(df):
for columnName, columnData in pizzas.iteritems():
print('n' + "*** Shapiro Test Results of '{}' ***".format(columnName))
p = round(shapiro(columnData.values)[1], 2)
p>alpha:
print(f"{p} <= {alpha}. We reject Null Hypothesis. '{columnName}' {Ha}")

print(f"{p} > {alpha}. We fail to reject Null Hypothesis. '{columnName}' {H0}")
check_normality(pizzas)
The above code outputs 👇
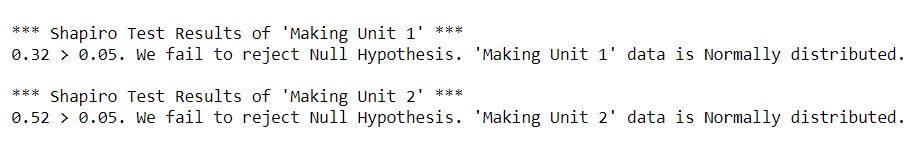
Data is normal, we can eliminate Mann Whitney Test. And external conditions are not given, so check for equality of variances.
Step 2: Check if the variances are equal.
We can use the Levene test to check the equality of variances
# Defining Null and Alternative Hypotheses
H0 = 'Variance of Unit A is approximately equal to Variance of Unit B'

Ha = 'Variance of Unit A is not equal to Variance of Unit B'


from scipy.stats import levene

def check_variances(df):

print('n' + "*** Variances Test Results' ***")

p = round(levene(pizzas['Making Unit 1'], pizzas['Making Unit 1'])[1],2)

if p>alpha:

print(f"{p} > {alpha}. We fail to reject Null Hypothesis. {H0}")

else:

print(f"{p} <= {alpha}. We reject Null Hypothesis. {Ha}")

check_variances(pizzas)
The above code outputs 👇
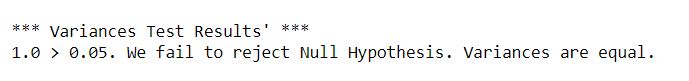
Variances are equal, so we go for 2 Sample T-test for equal variances
Step 3: Run the T-test for two samples with equal variances
Read more from T-test documentation
# Defining Null and Alternative Hypotheses
H0 = 'There is no significant difference.'

Ha = 'There exist a significant difference.'


from scipy.stats import ttest_ind

def t_test(df):

print('n' + "*** 2 Sample T Test Results ***")

test_results = ttest_ind(pizzas['Making Unit 1'], pizzas['Making Unit 1'], equal_var=True)

p = round(test_results[1],2)

if p>alpha:

print(f"{p} > {alpha}. We fail to reject Null Hypothesis. {H0}")

else:

print(f"{p} <= {alpha}. We reject Null Hypothesis. {Ha}")


t_test(pizzas)
Step 4: Conclude using the p-value from Step 3

The obtained p-value = 1.0 > alpha = 0.05. So we conclude by accepting the Null Hypothesis. There is no significant difference in the average diameter of pizzas between the two making units.
Conclusion
In the realm of data science, hypothesis testing stands out as a crucial tool, much like a detective’s key instrument. By mastering the relevant terminology, following systematic steps, setting decision rules, utilizing insights from the confusion matrix, and exploring diverse hypothesis test types, data scientists enhance their ability to draw meaningful conclusions. This underscores the pivotal role of hypothesis testing in data science for informed decision-making.
Thank you for reading till the conclusion. By the end of this article, we are familiar with the concept of Hypothesis testing and its implementation.
I hope you enjoyed reading this article, feel free to share it with your study buddies.
Here is a link to check out the code files.
Other Blog Posts by me
Feel free to check out my other blog posts from my Analytics Vidhya Profile.
You can find me on LinkedIn, Twitter in case you would want to connect. I would be glad to connect with you.
For immediate exchange of thoughts, please write to me at [email protected].
Happy Learning!