Recently, I was working on a business problem, which required me to find out inefficient branches of a bank X in North America and find root cause of their inefficiencies.
I had solved several root cause analysis problems in past but finding a quantitative parameter for efficiency was new to me. This was a complex task because efficiency was derived from multiple target variables such as branch revenue vs. capacity, customer satisfaction index, policy persistency etc. Can we assign some weights to each of the target variable and sum them to get efficiency? But how will we get such weights? Is there a scientific way to get these weight?
I did a small research and found a method using simplex programming to obtain efficiency in problems involving multiple input and output parameters. This technique is commonly known as Data Envelopment Analysis. Even though its a popular technique in OR, it is not very common in analytics industry. This article will give you a brief layout of the formulation and explain its utility by a business case.
[stextbox id=”section”]Lets start with a simple example:[/stextbox]
We have two processes A and B. Each process manufacture some jobs/week. And both jobs have different labor cost. As we know efficiency is a ratio of output and input, two processes will be compared based on their efficiency.Following are some illustrative figures:
Comparing the two efficiency, it can easily be concluded that Process A is more efficient than process B. That was easy! Lets make it slightly more complicated. Labor Cost might not be the only cost involved. The above analysis assumes that all other costs are similar for the two processes. Lets introduce an additional cost i.e. office rent. Now office rent is proportional to office premise area. Following are some illustrative figures:
The efficiency figures are now swapped. Process B seems to be more efficient when only office Area costs are considered. Now in this case, we know the office rent/square feet. Hence we can calculate the total cost, i.e. sum of Office rent/week and labor cost/week. And determine total efficiency of the two processes using total costs.
What made the determination easy for this case? We already knew the weights to be applied on each of the input variable i.e. Office Area and Labor cost. The weight for Office area was rent/square feet and that of labor cost was one.
[stextbox id=”section”]Lets complicate the puzzle further:[/stextbox]
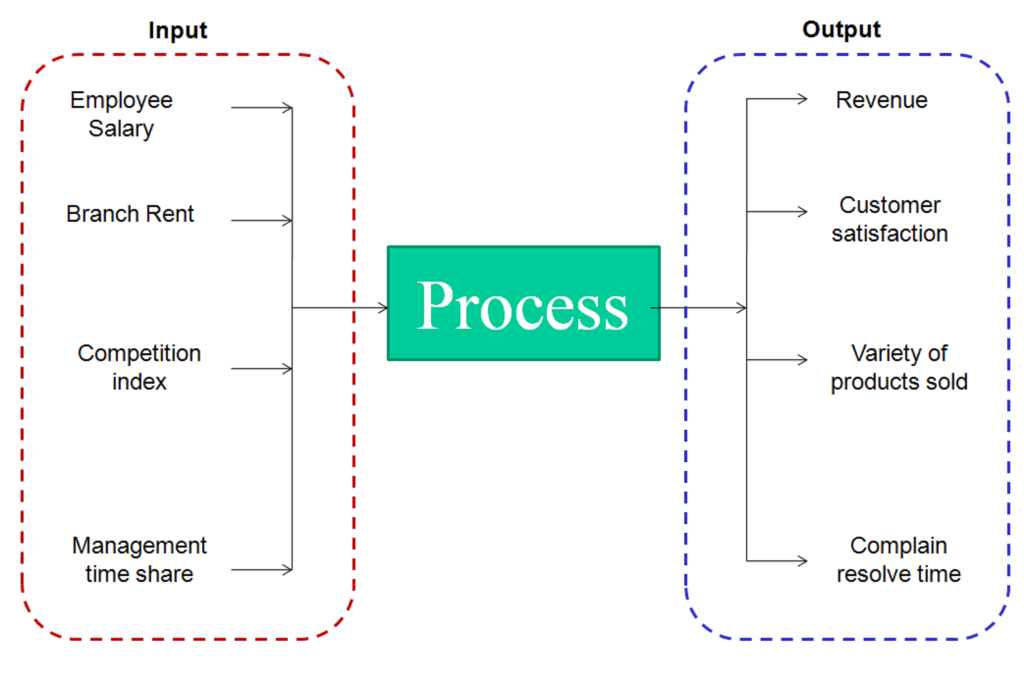
The output in this case was simply throughput. In a real life scenario, the inputs and outputs are non comparable parameters. Lets take example of a bank branches. The objective is to compare the branch efficiency and find the most efficient branch. Following are some of the identified input and output parameter of these branches :
First step in any efficiency problem is to identify independent inputs and outputs. Make sure that the inputs and outputs are independent variables. In the above scenario, Employee salary and Branch Rent is in terms of dollars, Competition index (Degree of competition in locality) is an index and Management time share is a percentage term. Clearly Input variables are non additive. Similarly, output parameters are non-additive as well. We will derive an effectiveness of each branch using all these variables.
[stextbox id=”section”]Know the Maths behind:[/stextbox]
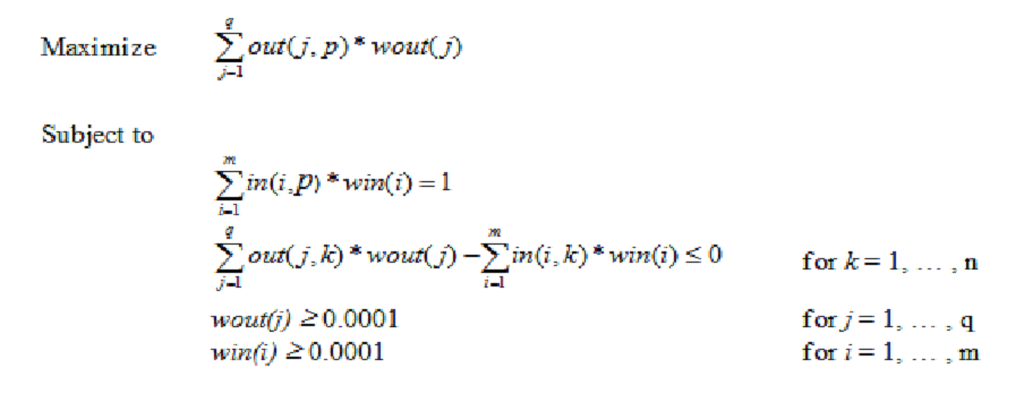
The DEA technique is a kind of simple linear programming. It assumes certain aspects and knowing these aspects is essential before applying the technique. The formulation will make the assumptions clear. Following are the abbreviations used in this formulation :
1. Formulation is done for p processes
2. in(i,k) is the i th input parameter for the k th process
3. out(j,k) is the j th output parameter for the k th process
4. win(i) is the weight of i th input parameter
5. wout(j) is the weight of jth output parameter
1. The Input and Output of each business unit are linear functions.
2. Each of input and output variables are independent of each other
3. Input and Output variables are exhaustive
[stextbox id=”section”] Lets find efficiency graphically:[/stextbox]
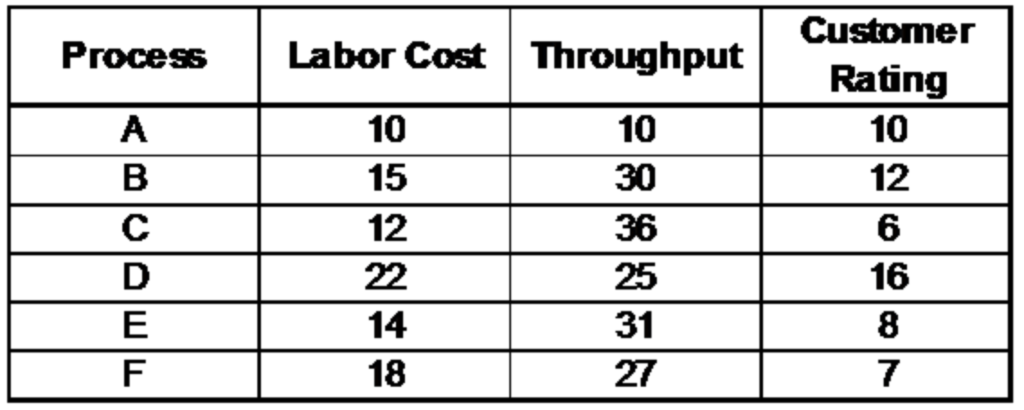
Suppose following are the input and output variables of 6 Processes :
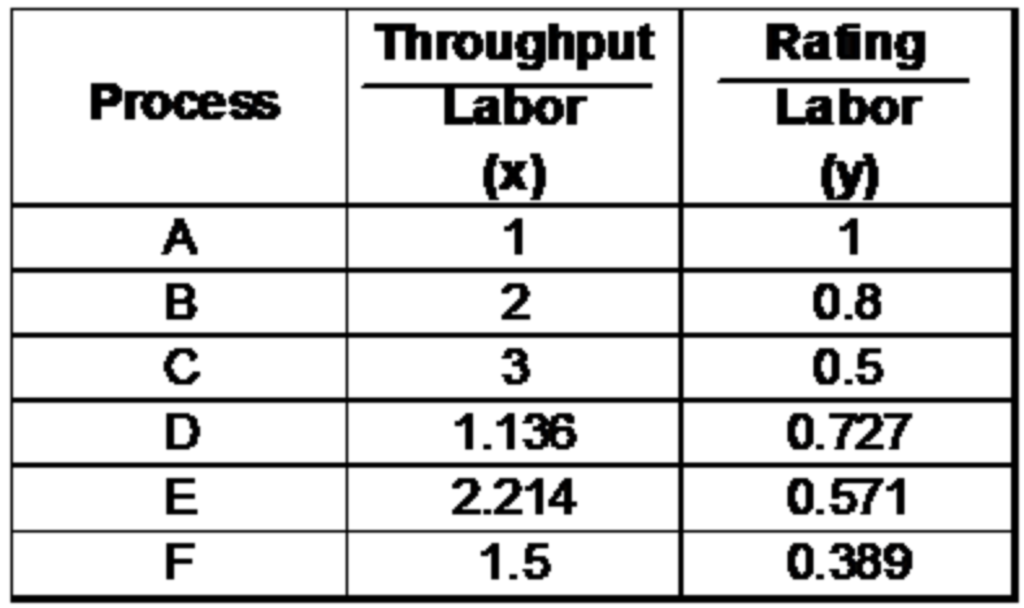
We define the two independent efficiency based on the two output parameters,
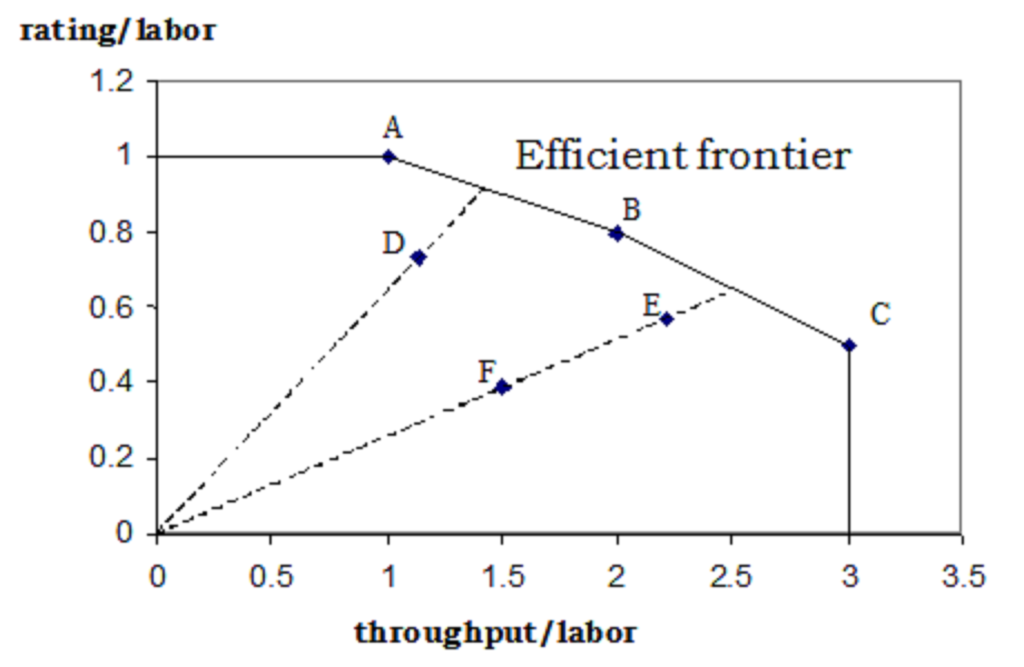
Lets plot the two efficiency graphically.
As the name suggests, DEA defines an envelope of 100% efficiency. ABC is the envelope and any point inside the envelope is an inefficient unit.The graphical representation was easy for a two dimensional problem. But for the bank branch problem discussed in the last section, we will have to draw a 9 ( 4-1 * 4-1) dimensional envelope and hence very difficult to visualize.
[stextbox id=”section”]Advantages of DEA technique:[/stextbox]
Following are the advantages of the technique :
What do think of this technique? Do you think this provides solution to any problem you face? Are there any other techniques you use to find efficiency of different business units? Are you able to tackle the linearity assumption with this technique? Do let us know your thoughts in comments below.


