This article was published as a part of the Data Science Blogathon.
Why Use Earth Engine
Earth Engine is a cloud-computing platform for Remote Sensing analysis. As a cloud-computing platform, it provides many open-source satellite images so that users can process them without downloading the raw data. This is very practical especially when the required data have big memory space. Another advantage is that users can rely on Earth Engine memory capacity in processing those big-size data.
This article discusses publishing a web app with linked multiple panels using the Earth Engine platform. This web app is a new feature of Earth Engine. It is very handy because big-size information can be shared openly by just a hyperlink.
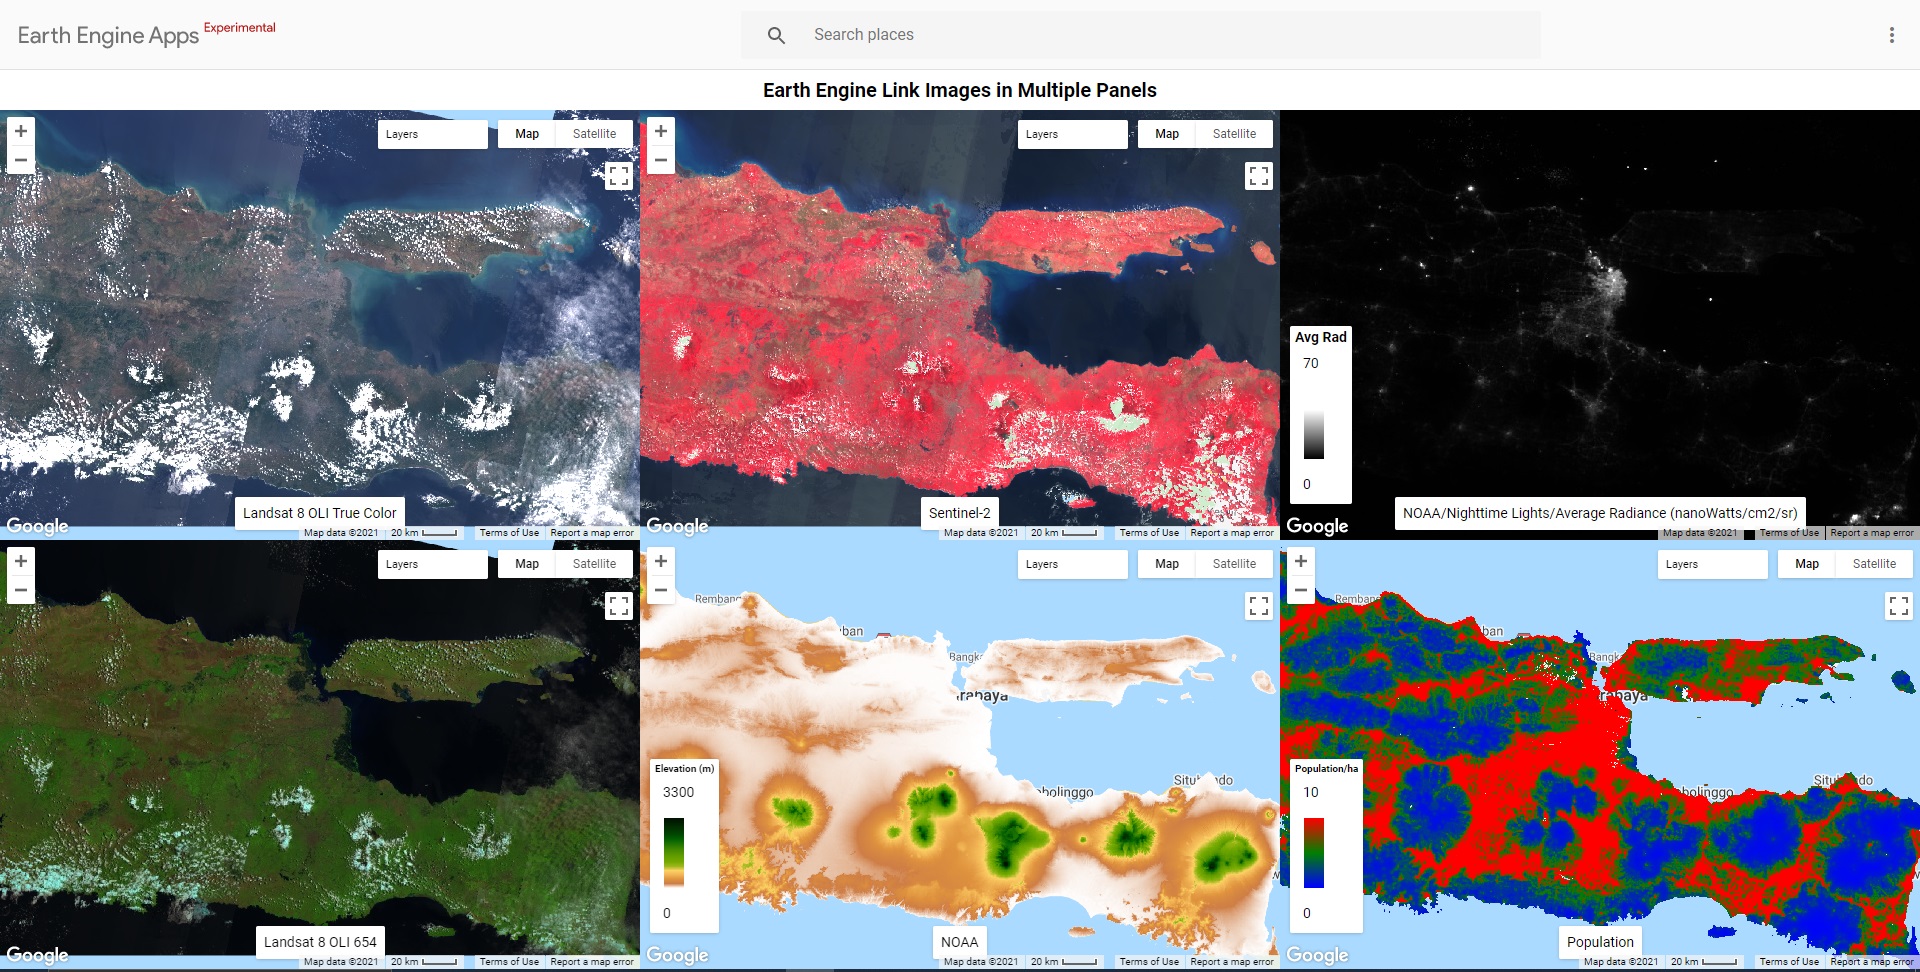
This article will demonstrate the process and show the result of the interactive web app with 6 panels. All of the panels contain linked images. Each panel can have more than one layer to display. But before sharing the result, let’s take a look at the displayed raster in the 6 panels.
Multispectral Images (Landsat 8 OLI and Sentinel-2)
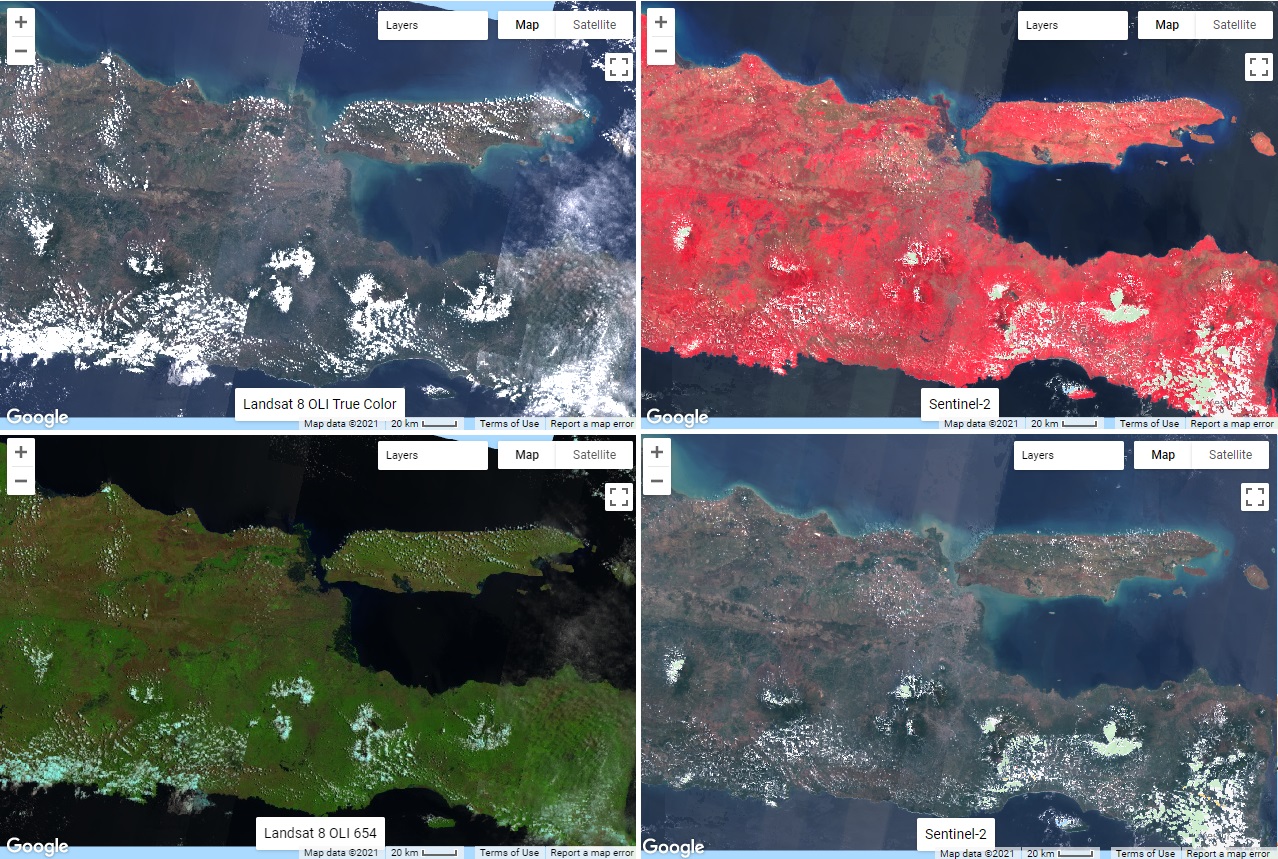
For multispectral satellite images, Landsat 8 OLI and Sentinel-2 are well-known. These images are widely used to acquire information on land use and land cover. Take Landsat 8 OLI for example. Landsat 8 OLI is the image of the earth captured every 16 days. The collection has been archived for years since 2013. In this article, I will demonstrate how to show Landsat 8 OLI images. It actually can show the result for the whole world, but I will just limit the area to be in East Java only.
Below is the code to display Landsat 8 OLI and Sentinel-2 images from July 2020 to September 2020. I will display Landsat 8 OLI with composite 432 as the true color and composite 654 as the false color. The composite 654 is good to distinguish vegetation and open land. For Sentinel-2, I will display the composite 432 as the true color and composite 843 as the false color. The composite 843 is good for observing earth surface relief.
// Create Multiple Panels

// Map 1: Landsat 8 OLI 432

var map1 = ui.Map();

map1.add(ui.Label('Landsat 8 OLI True Color',{position: 'bottom-center'}));

// set date Jul-Sep 2020

var tahun = [2020];

var bulan = [7,7,8,8,9,9];

var tgl1 = [1,16,1,16,1,16];

var tgl2 = [15,31,15,31,15,30];

var week = ['1st Week', '2nd Week','1st Week', '2nd Week','1st Week', '2nd Week'];

var display = [false,false,false,false,false,true];

var i;

var j;

// Load Landsat 8 images.

for (i = 0; i<tahun.length;i++){

  for(j = 0; j<bulan.length;j++){

    var composite = ee.ImageCollection('LANDSAT/LC08/C01/T1_TOA')

    .filterDate( tahun[i] + "-" + bulan[j]  + "-" + tgl1[j], tahun[i] + "-" + bulan[j] + "-" + tgl2[j])

    .median();

    // Clip image.

    var clipped = composite.clip(geometry);

    map1.addLayer(clipped , {min:0, max:0.3, bands: ['B4', 'B3', 'B2']}, "date " + tahun[i] + "-" + bulan[j]  + "-" + week[j], display[j] );
  }
}

map1.setControlVisibility(true);
// Map 2: Landsat 8 OLI 654
var map2 = ui.Map();
map2.add(ui.Label('Landsat 8 OLI 654',{position: 'bottom-center'}));
for (i = 0; i<tahun.length;i++){
  for(j = 0; j<bulan.length;j++){
    var composite = ee.ImageCollection('LANDSAT/LC08/C01/T1_TOA')
    .filterDate( tahun[i] + "-" + bulan[j]  + "-" + tgl1[j], tahun[i] + "-" + bulan[j] + "-" + tgl2[j])
    .median();
    // Clip images
    var clipped = composite.clip(geometry);
    map2.addLayer(clipped , {bands: ['B6', 'B5', 'B4']}, "date " + tahun[i] + "-" + bulan[j]  + "-" + week[j], display[j]);
  }
}
map2.setControlVisibility(true);
// Map 3: Sentinel-2
var map3 = ui.Map();
map3.add(ui.Label('Sentinel-2',{position: 'bottom-center'}));
// Function to mask clouds QA band.
function maskS2clouds(image) {
  var qa = image.select('QA60');
  var cloudBitMask = 1 << 10;
  var cirrusBitMask = 1 << 11;
  var mask = qa.bitwiseAnd(cloudBitMask).eq(0).and(
            qa.bitwiseAnd(cirrusBitMask).eq(0));
  return image.updateMask(mask).divide(10000)
      .select("B.*")
      .copyProperties(image, ["system:time_start"]);
}
// set date Jul-Sep 2020
var tahun_ = [2020];
var bulan_ = [7,8,9];
var tgl1_ = [1,1,1];
var tgl2_ = [31,31,30];
var display_ = [false,false,true];
var i;
var j;
for (i = 0; i<tahun_.length;i++){
  for(j = 0; j<bulan_.length;j++){
    var collection = ee.ImageCollection('COPERNICUS/S2')
    .filterDate(tahun_[i] + "-" + bulan_[j]  + "-" + tgl1_[j], tahun_[i] + "-" + bulan_[j] + "-" + tgl2_[j])
    // Filter cloudy.
    .filter(ee.Filter.lt('CLOUDY_PIXEL_PERCENTAGE', 20))
    .map(maskS2clouds);
    var composite = collection.median();
    // Clip images
    var clipped = composite.clip(geometry);
    // Display the results.
    map3.addLayer(clipped, {bands: ['B4', 'B3', 'B2'], min: 0, max: 0.3}, 'Composite 432 '+tahun_[i] + "-" + bulan_[j], false);
    map3.addLayer(clipped, {bands: ['B8', 'B4', 'B3'], min: 0, max: 0.3}, 'Composite 843 '+tahun_[i] + "-" + bulan_[j], display_[j]);
  }
}
map3.setControlVisibility(true);
SRTM
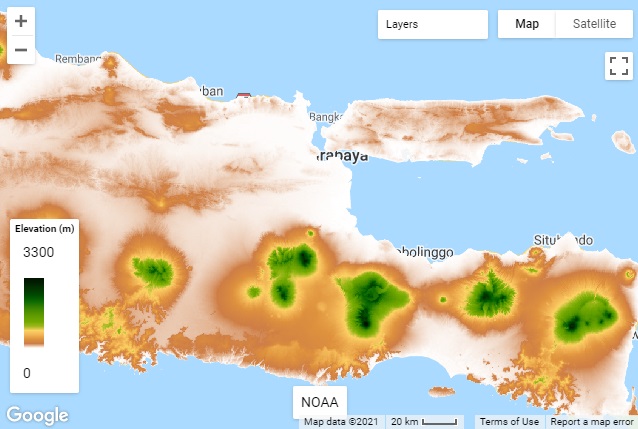
Not only can satellite images give land cover information, but they can also provide elevation information. Shuttle Radar Topography Mission (SRTM) can provide elevation information. The code below shows the SRTM in East Java. The white to green gradation represents the elevation level from 0 to 3300 meters. It clearly shows from the flat to mountainous areas.
// Map 4: SRTM

var map4 = ui.Map();

map4.add(ui.Label('NOAA',{position: 'bottom-center'}));

// Load SRTM

var srtm = ee.Image('CGIAR/SRTM90_V4');

// Clip image

var srtm = srtm.clip(geometry);

// Make visual parameter

var vizParam = {min:0, max:3300, palette:['FFFFFF', 'CE7E45', 'DF923D', 'F1B555', 'FCD163', '99B718',

               '74A901', '66A000', '529400', '3E8601', '207401', '056201',

               '004C00', '023B01', '012E01', '011D01', '011301']};

// Display the image.

map4.addLayer(srtm, vizParam, 'SRTM');
Population
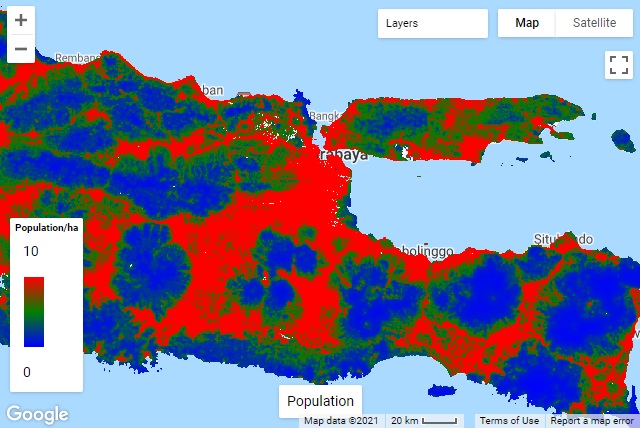
Earth Engine also makes world population available in a raster image. This image definitely shows populated areas in cities. Each pixel contains the value of the estimated population number in 100-meter x 100-meter grid cells.
// Map 5:

var map5 = ui.Map();

map5.add(ui.Label('NOAA/Nighttime Lights/Average Radiance (nanoWatts/cm2/sr)',{position: 'bottom-center'}));

var nightdata = ee.ImageCollection('NOAA/VIIRS/DNB/MONTHLY_V1/VCMSLCFG')

                  .filter(ee.Filter.date('2020-07-01', '2020-09-30'));

var night = nightdata.select('avg_rad'); //nanoWatts/cm2/sr

var vizParam5 = {min: 0.0, max: 70.0, palette:['black','white']};

map5.addLayer(night, vizParam5, 'NOAA');

map5.setControlVisibility(false);
NOAA
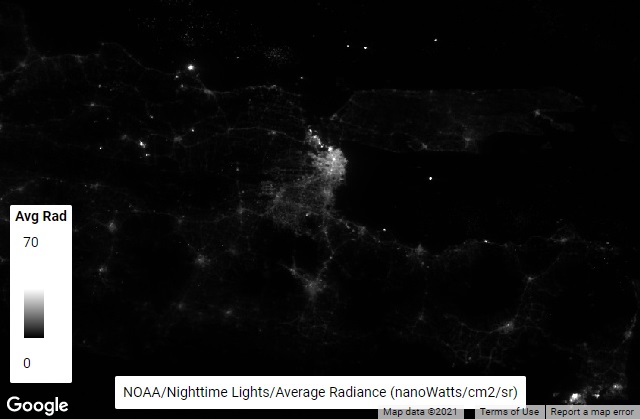
Actually, there are still other many pieces of spatial information that can be retrieved from satellite images related to climate and weather, temperature, land or terrain, and so on. But, for this article, I will just show another use of satellite images. The following code displays National Oceanic and Atmospheric Administration (NOAA) images showing nighttime light. Later, we can see that crowded cities have higher nighttime light.
var map6 = ui.Map();

map6.add(ui.Label('Population',{position: 'bottom-center'}));

var population = ee.ImageCollection("WorldPop/GP/100m/pop");

var vizParam6 = {min:0, max:10, palette:['blue','green','red']};

map6.addLayer(population, vizParam6, 'Population');

map6.setControlVisibility(true);
Linked Multiple Panels
So, now we have many processed images to show. We can choose which image to show from the “layers”. But, what if we want to compare more than one image at the same time. Let say, we want to display Landsat 8 OLI, Sentinel-2, SRTM, world population, and NOAA altogether on the screen. We need multiple panels for that. Below is the code to accomplish the task.
// Link images

var linker = ui.Map.Linker([map1, map2, map3, map4, map5, map6]);

// Enable zooming

map1.setControlVisibility({zoomControl: true});

// Show scale

map3.setControlVisibility({scaleControl: true});

// Create a grid of maps.

var mapPanel = ui.Panel(

    [

      ui.Panel([map1, map2], null, {stretch: 'both'}),

      ui.Panel([map3, map4], null, {stretch: 'both'}),

      ui.Panel([map5, map6], null, {stretch: 'both'})

    ],

    ui.Panel.Layout.Flow('horizontal'), {stretch: 'both'});

// map center

map1.setCenter(112.4729, -7.4809, 8);

// Map title.

var title = ui.Label('Earth Engine Link Images in Multiple Panels', {

  stretch: 'horizontal',

  textAlign: 'center',

  fontWeight: 'bold',

  fontSize: '20px'

});

// Add images and title to the ui.root.

ui.root.widgets().reset([title, mapPanel]);

ui.root.setLayout(ui.Panel.Layout.Flow('vertical'));
Sharing Web App
The last step we may want to do is to share our results with others. Without Earth Engine, we can export and save the results of the processed images and send them to others via sharing drive or flash disc. But, the other users need to have GIS software to access the processed data. It also takes time to reopen and sort lots of images. What if we need to share the results with others who are not familiar with GIS, Remote Sensing, or Data Science.
The solution is to publish the results to a web app. This is a recent feature provided by Earth Engine. The images in multiple panels can be published into a web app. Then, to share the web app, just share the hyperlink like this. Click on that link and you can go to the interactive web app displaying all of the above results. It looks like this
About Author
Connect with me here.
The media shown in this article are not owned by Analytics Vidhya and is used at the Author’s discretion.


