


This article was published as a part of the Data Science Blogathon
Pandas
Pandas is an open-source data analysis and data manipulation library written in python. Pandas provide you with data structures and functions to work on structured data seamlessly. The name Pandas refer to “Panel Data”, which means a structured dataset. Pandas have two main classes to work on, DataFrame and Series. Let us explore more on this later in this article.
Key Features of Pandas
- Perform Group by operation seamlessly
- Datasets are mutable using pandas which means we can add new rows and columns to them.
- Easy to handle missing data
- Merge and join datasets
- Indexing and subsetting data
Installation
Install via pip using the following command,
pip install pandas
Install via anaconda using the following command,
conda install pandas
DataFrame in Pandas
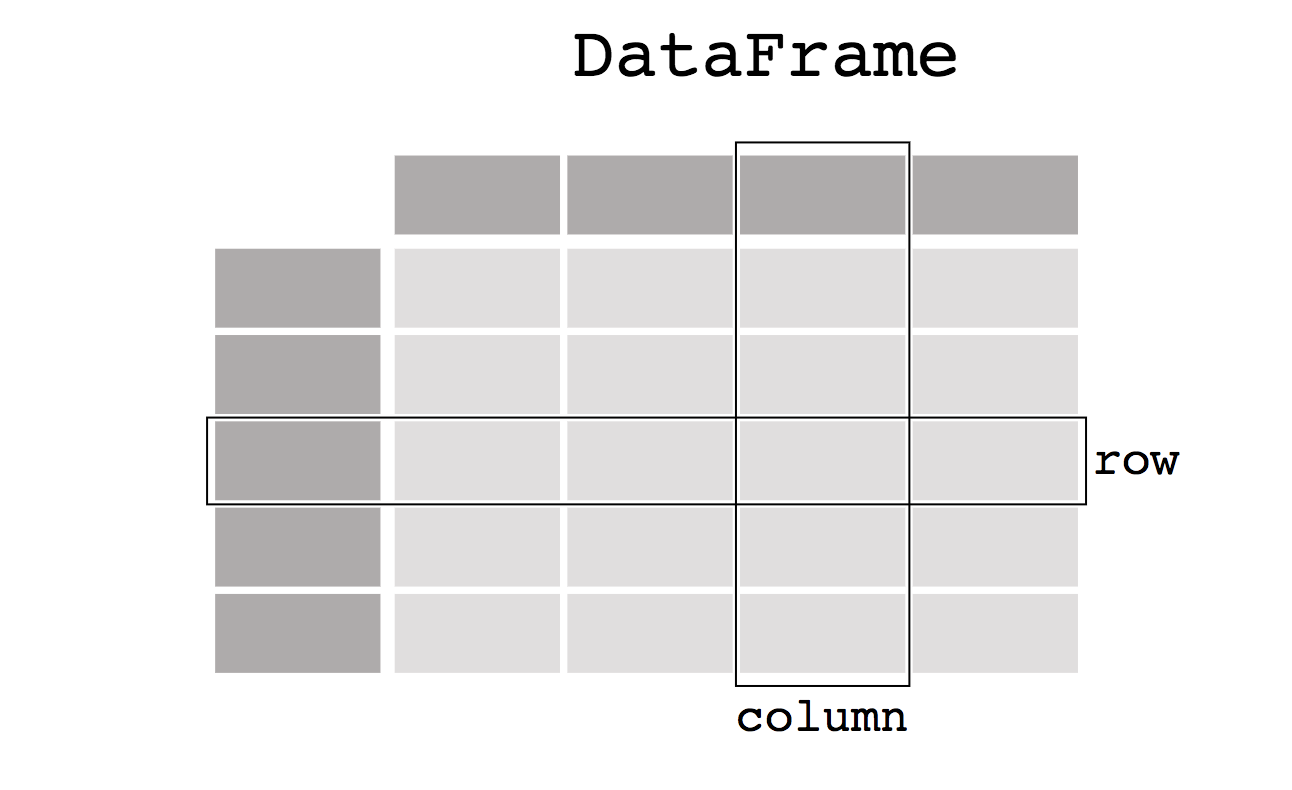
A DataFrame is a two-dimensional table in pandas. Each column can have different data types like int, float, or string. Each column is of class Series in pandas, we’ll discuss this later in this article.
Creating a DataFrame in Pandas
# import the library as pd
import pandas as pd
df = pd.DataFrame(
    {
        'Name': ['Srivignesh', 'Hari'],
        'Age': [22, 11],
        'Country': ['India', 'India']
    }
)
print(df)
# output
#         Name  Age Country
# 0  Srivignesh   22   India
# 1        Hari   11   India
pd.DataFrame is a class available in pandas. Here we provide a dictionary whose keys are the column names (‘Name’, ‘Age’, ‘Country’) and the values are the values in those columns. Here each column is of class pandas.Series. Series is a one-dimensional data used in pandas.
# accessing the column 'Name' in df
print(df['Name'])
# Output
# 0    Srivignesh
# 1          Hari
# Name: Name, dtype: object
print(type(df['Name']))
# Output
# <class 'pandas.core.series.Series'>
Let’s get started with Data Manipulation using Pandas!
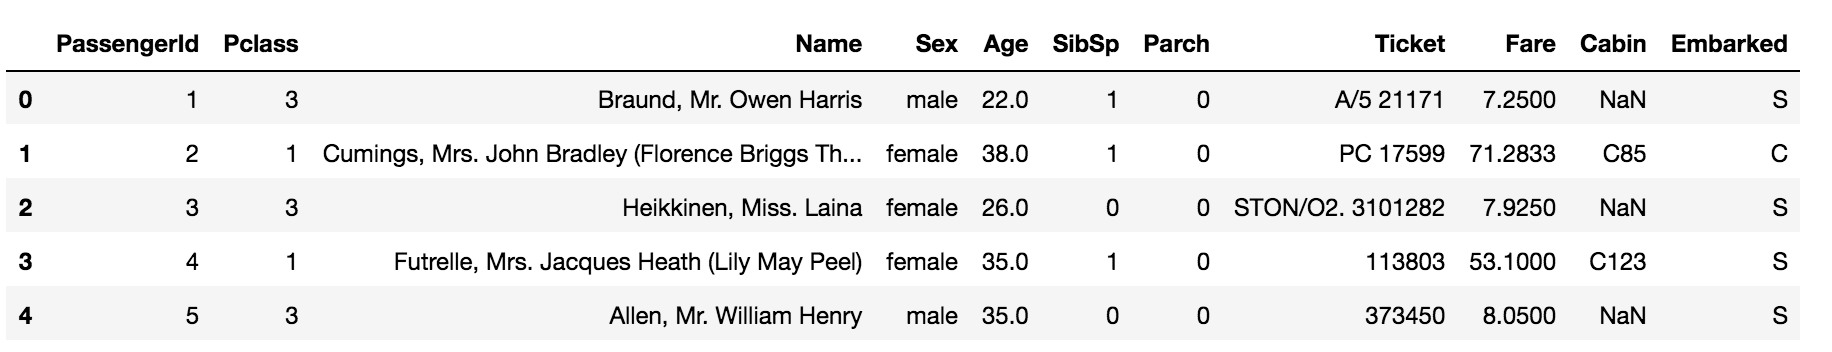
For this purpose, we are going to use Titanic Dataset which is available on Kaggle.
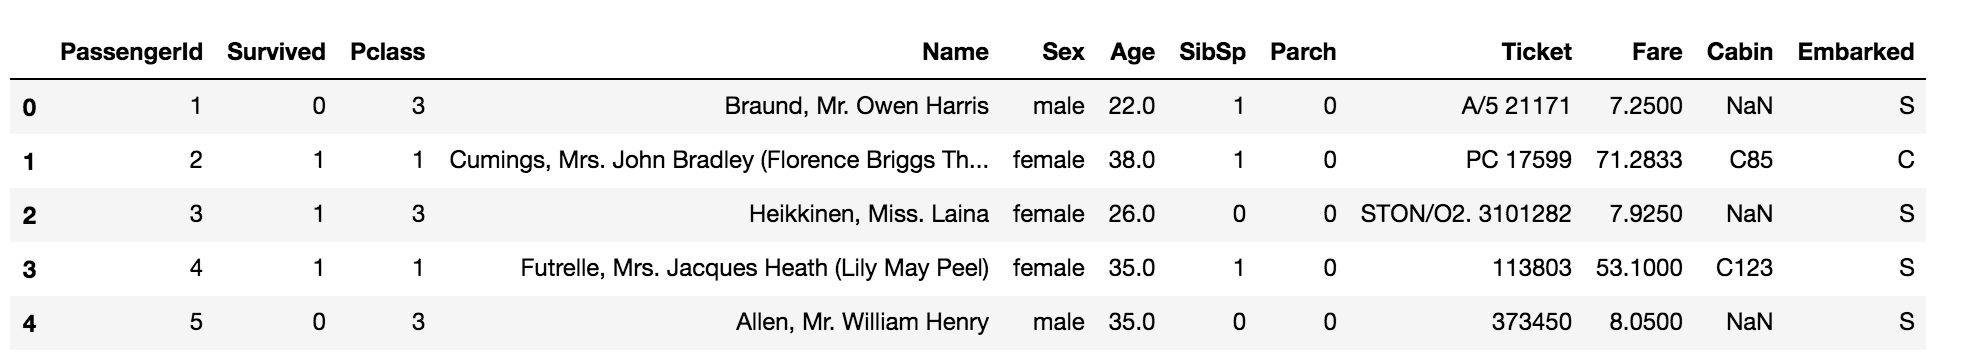
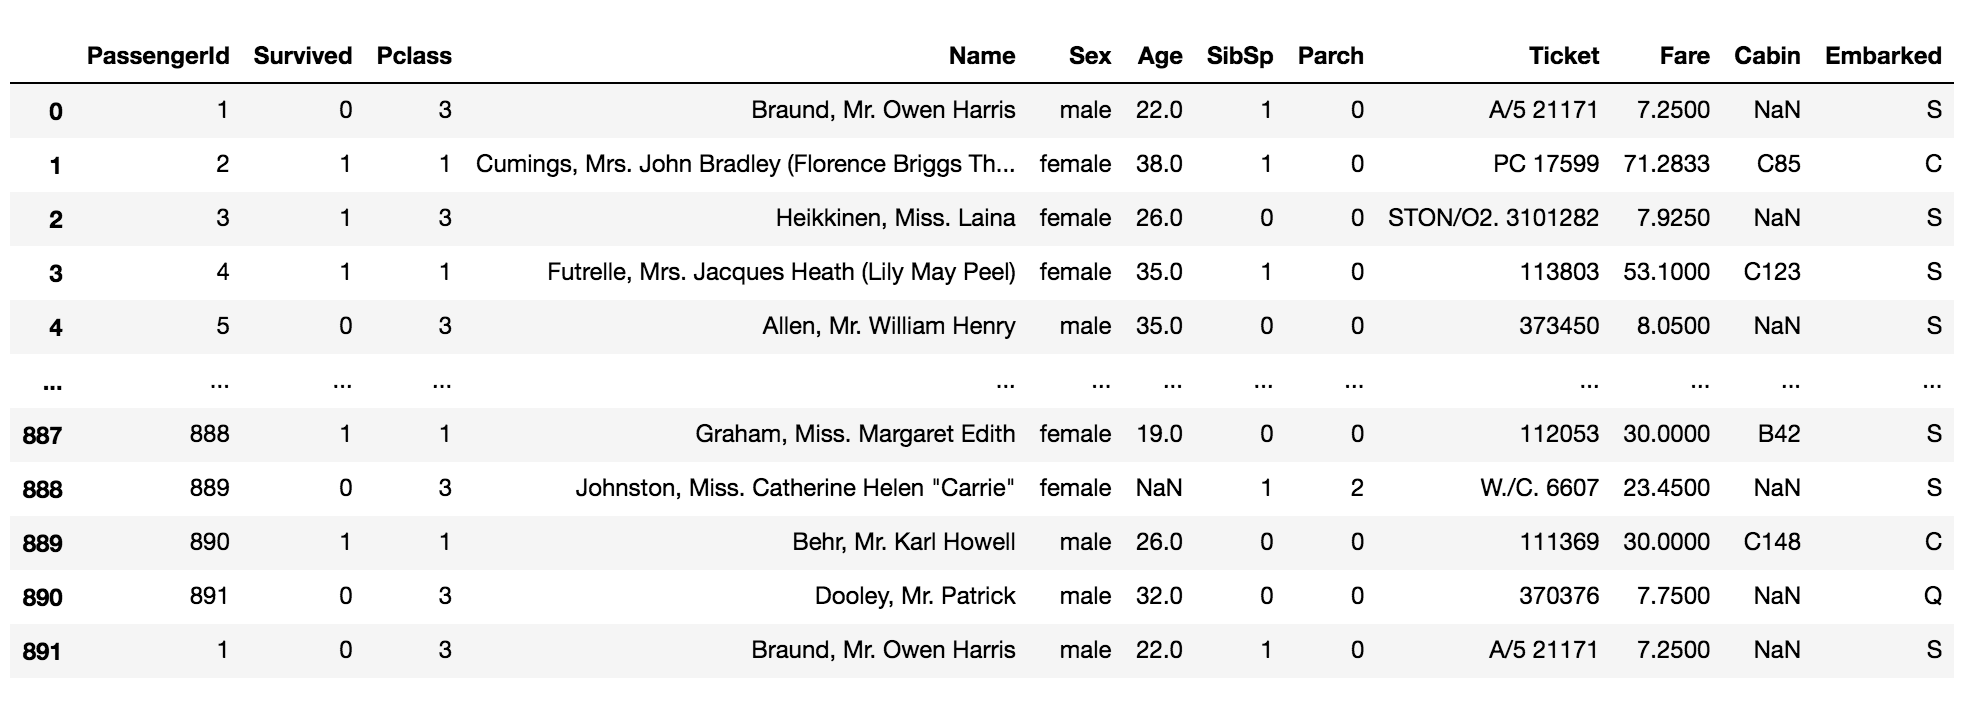
import pandas as pd
path_to_data = 'path/to/titanic_dataset'
# read the csv data using pd.read_csv function
data = pd.read_csv(path_to_data)
data.head()
Dropping columns in the data
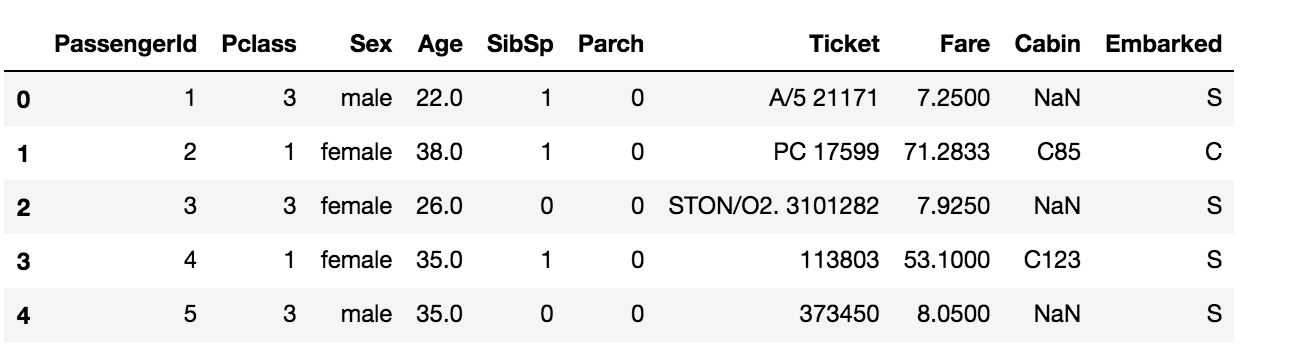
df_dropped = data.drop('Survived', axis=1)
df_dropped.head()

The ‘Survived’ column is dropped in the data. The axis=1 denotes that it ‘Survived’ is a column, so it searches ‘Survived’ column-wise to drop.
Drop multiple columns using the following code,
df_dropped_multiple = data.drop(['Survived', 'Name'], axis=1)
df_dropped_multiple.head()
The columns ‘Survived’ and ‘Name’ are dropped in the data.
Dropping rows in the data
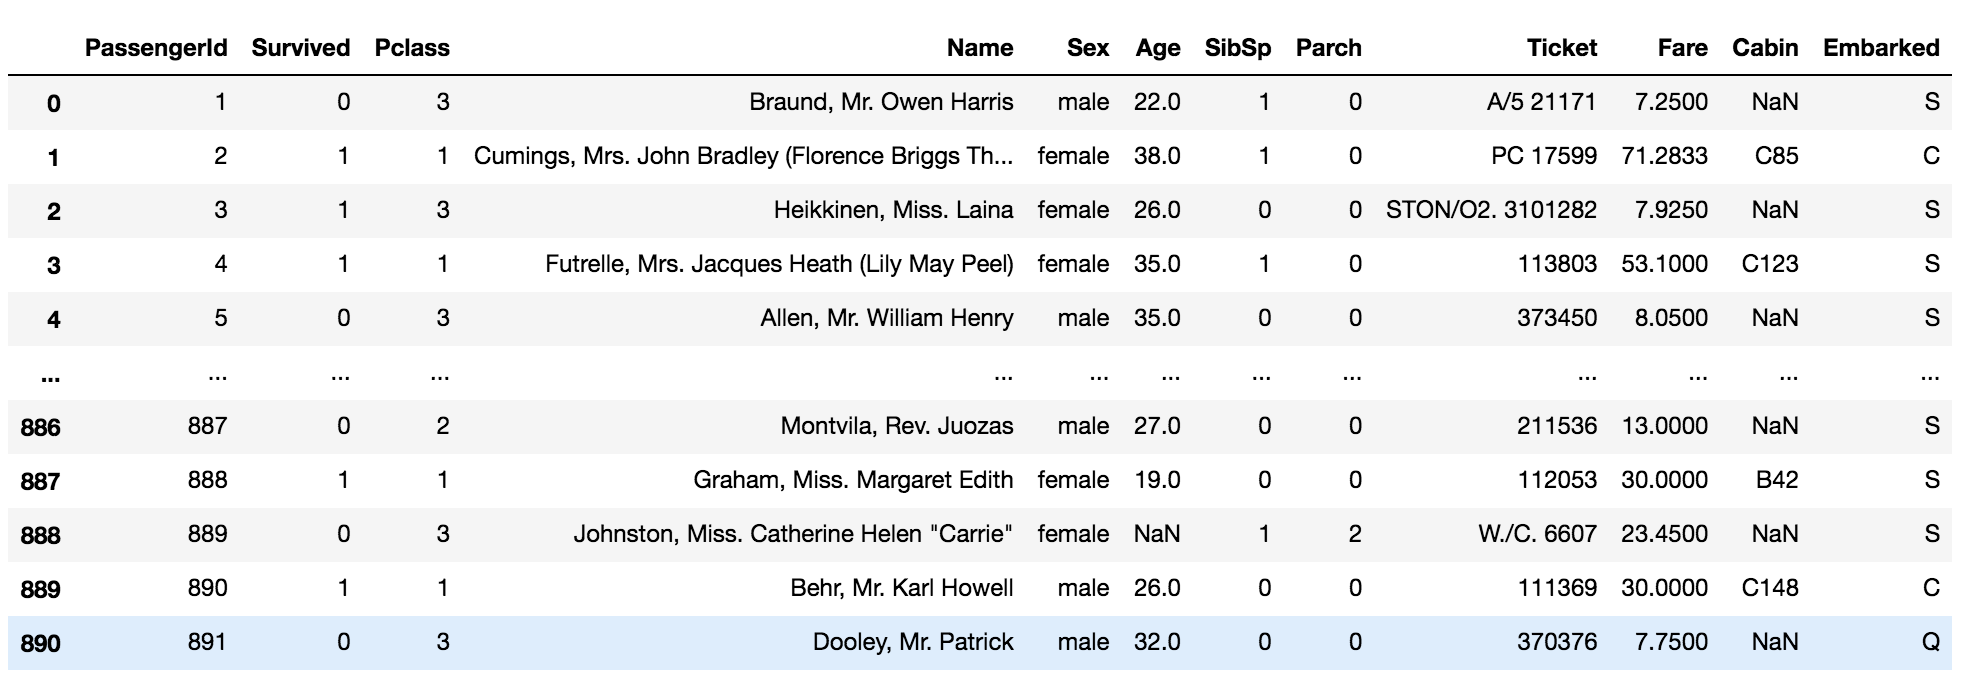
df_row_dropped = data.drop(2, axis=0)
df_row_dropped.head()
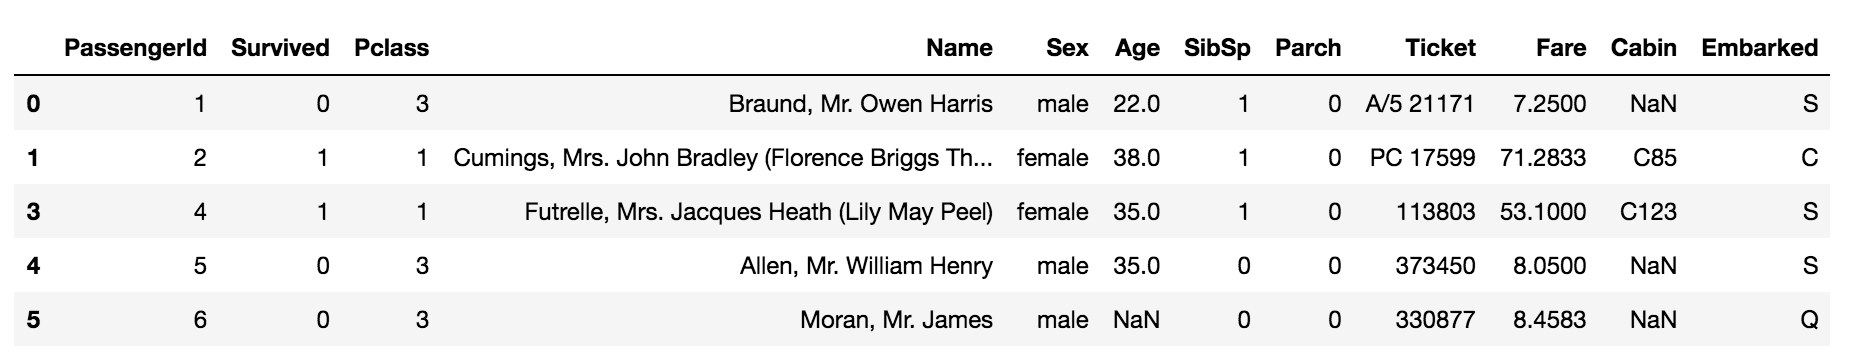
The row with index 2 is dropped in the data. The axis=0 denotes that index 2 is a row, so it searches the index 2 column-wise.
Drop multiple rows using the following code,
df_row_dropped_multiple = data.drop([2, 3], axis=0)
df_row_dropped_multiple.head()
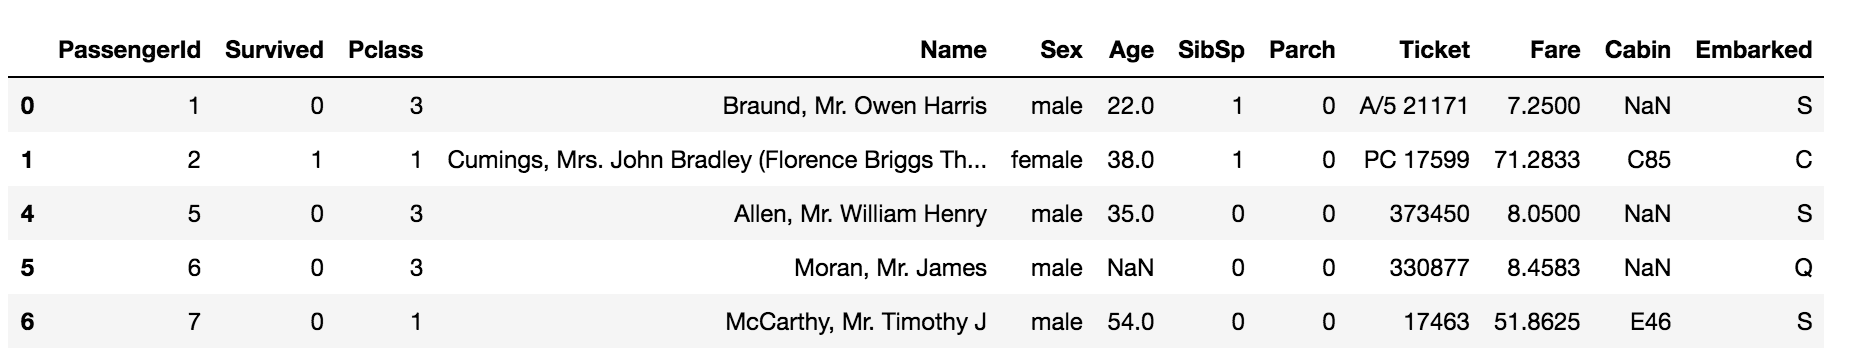
The rows with indexes 2 and 3 are dropped in the data.
Renaming a column in the dataset
data.columns
# Output
# Index(['PassengerId', 'Survived', 'Pclass', 'Name', 'Sex', 'Age', 'SibSp',
#        'Parch', 'Ticket', 'Fare', 'Cabin', 'Embarked'],
#       dtype='object')
df_renamed = data.rename(columns={'PassengerId': 'Id'})
df_renamed.head()
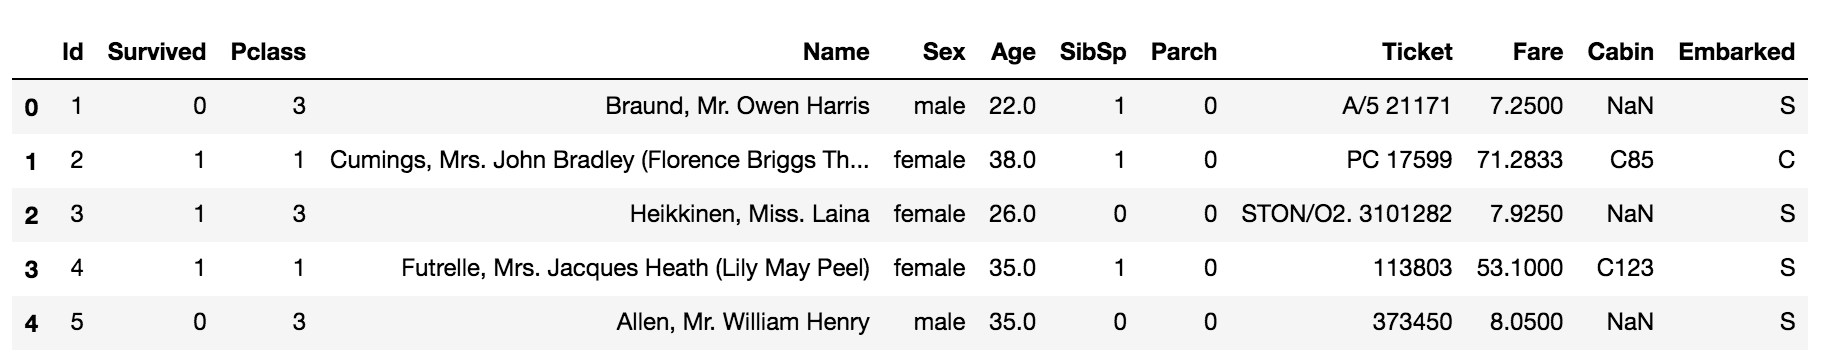
The column ‘PassengerId’ is renamed to ‘Id’ in the data. Do not forget to mention the dictionary inside the columns parameter.
Rename multiple columns using the following code,
df_renamed_multiple = data.rename(
    columns={
        'PassengerId': 'Id',
        'Sex': 'Gender',
    }
)
df_renamed_multiple.head()
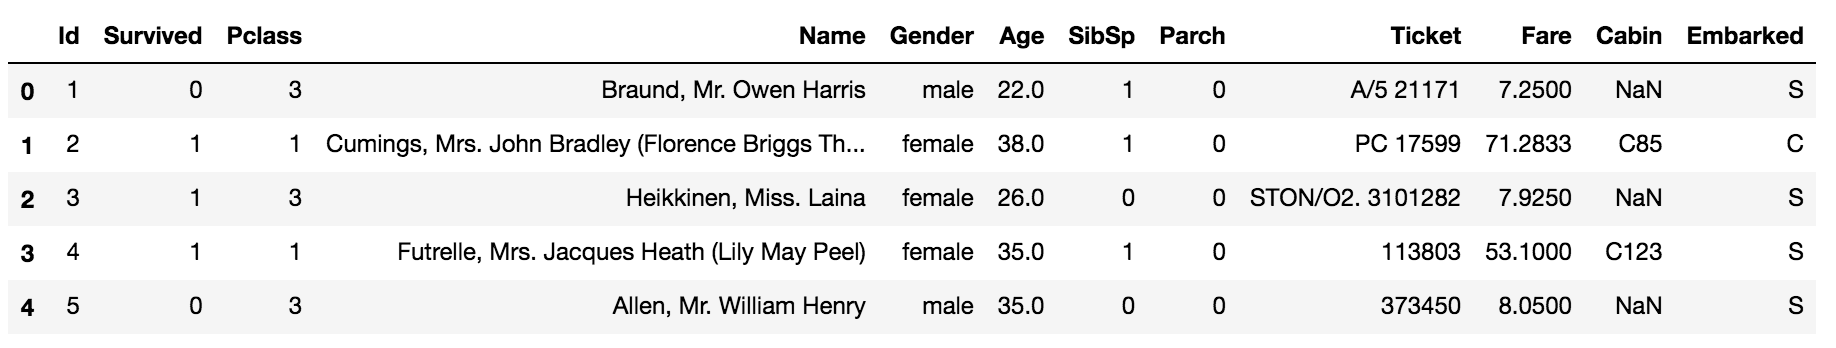
The columns ‘PassengerId’ and ‘Sex’ are renamed to ‘Id’ and ‘Gender’ respectively.
Select columns with specific data types
integer_data = data.select_dtypes('int')
integer_data.head()
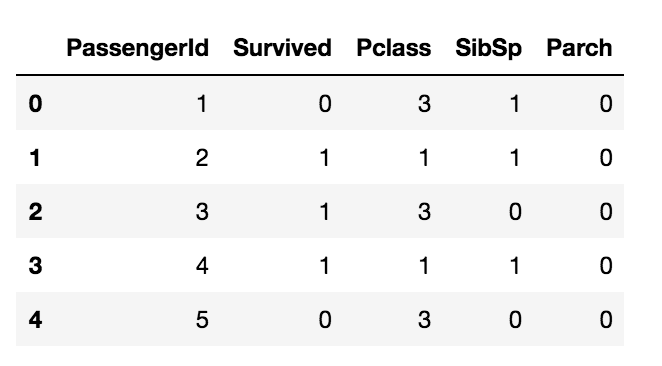
The above code selects all columns with integer data types.
float_data = data.select_dtypes('float')
float_data.head()
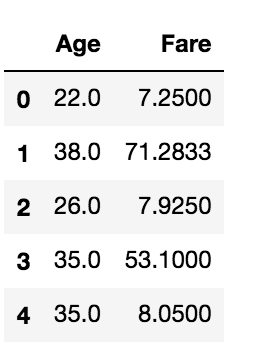
The above code selects all columns with float data types.
Slicing the dataset
data.iloc[:5, 0]
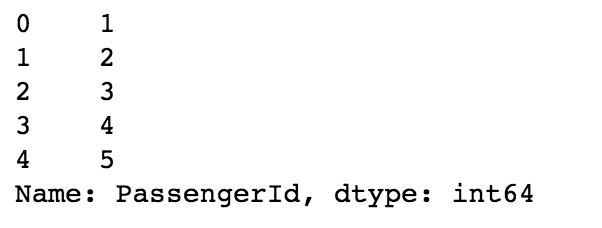
The above code returns the first five rows of the first column. The ‘:5’ in the iloc denotes the first five rows and the number 0 after the comma denotes the first column, iloc is used to locate the data using numbers or integers.
data.loc[:5, 'PassengerId']
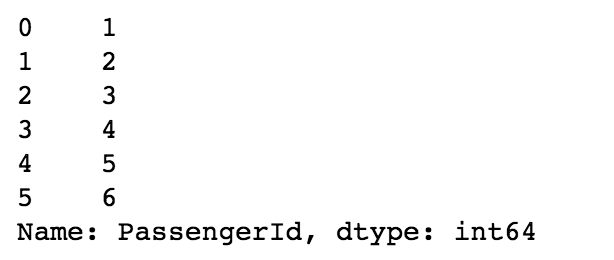
The above code does the same but we can use the column names directly using loc in pandas. Here the index 5 is inclusive.
Handle Duplicates in Dataset
Since there are no duplicate data in the titanic dataset, let us first add a duplicated row into the data and handle it.
df_dup = data.copy()
# duplicate the first row and append it to the data
row = df_dup.iloc[:1]
df_dup = df_dup.append(row, ignore_index=True)
df_dup
df_dup[df_dup.duplicated()]
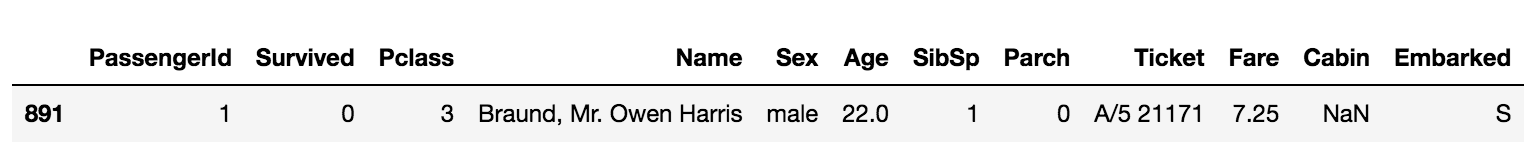
The above code returns the duplicated rows in the data.
df_dup.drop_duplicates()
The above code drops the duplicated rows in the data.
Select specific values in the column
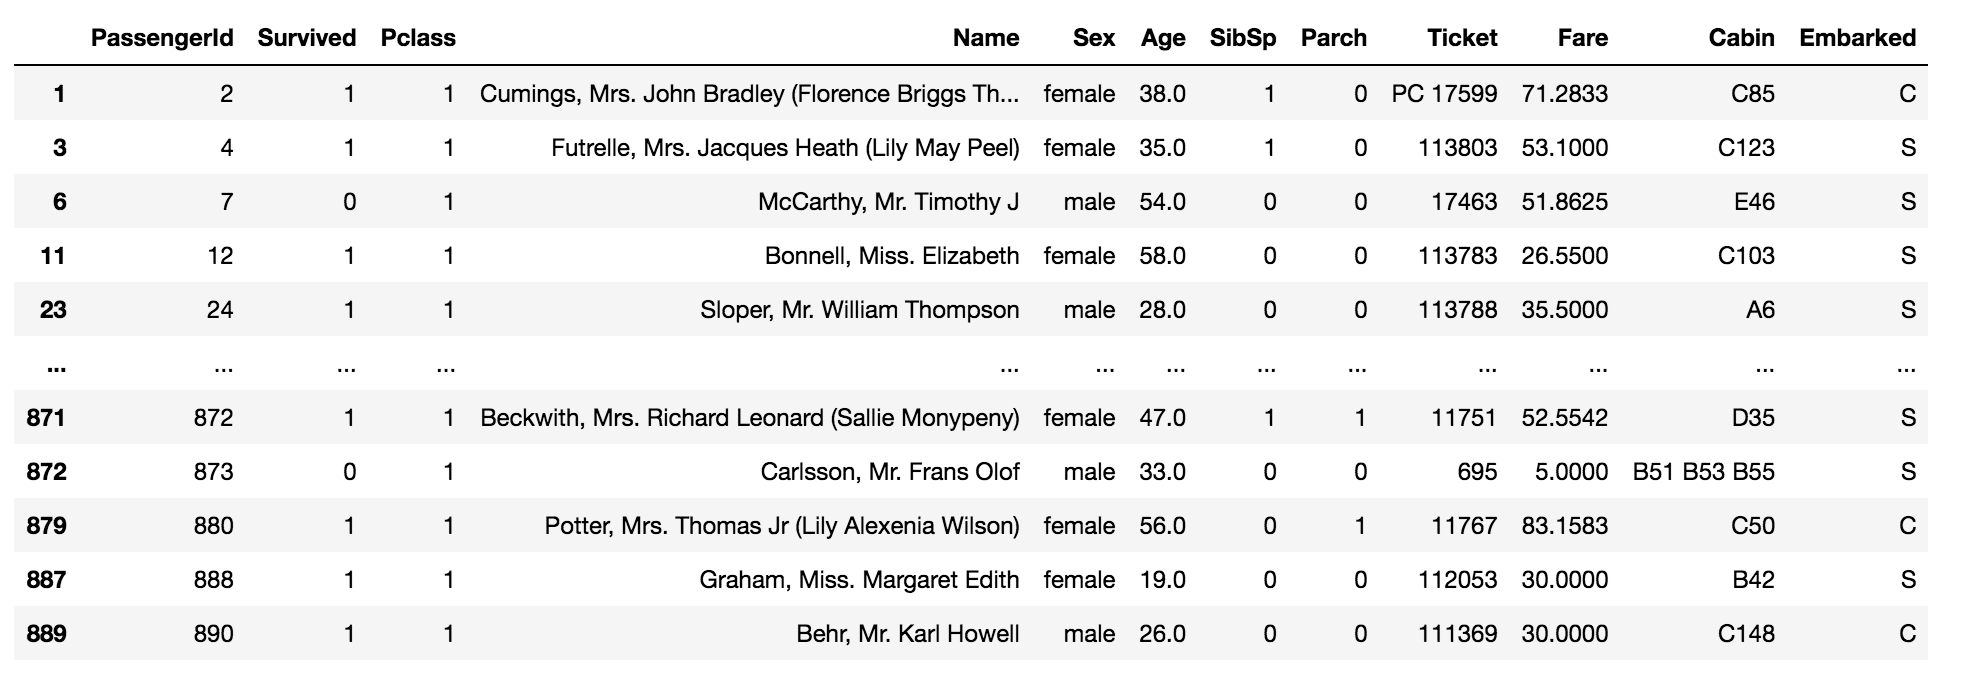
data[data['Pclass'] == 1]

The above code returns the values which are equal to one in the column ‘Pclass’ in the data.
Select multiple values in the column using the following code,
data[data['Pclass'].isin([1, 0])]
The above code returns the values which are equal to one and zero in the column ‘Pclass’ in the data.
Group by in DataFrame
data.groupby('Sex').agg({'PassengerId': 'count'})
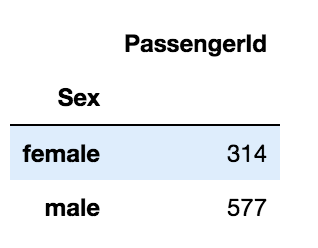
The above code groups the values of the column ‘Sex’ and aggregates the column ‘PassengerId’ by the count of that column.
data.groupby('Sex').agg({'Age':'mean'})
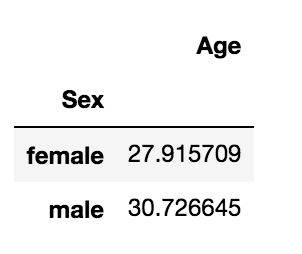
The above code groups the values of the column ‘Sex’ and aggregates the column ‘Age’ by mean of that column.
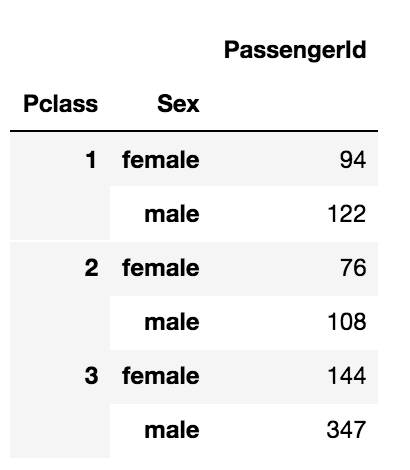
Group multiple columns using the following code,
data.groupby(['Pclass', 'Sex']).agg({'PassengerId': 'count'})
Map in Pandas
data['Survived'].map(lambda x: 'Survived' if x==1 else 'Not-Survived')
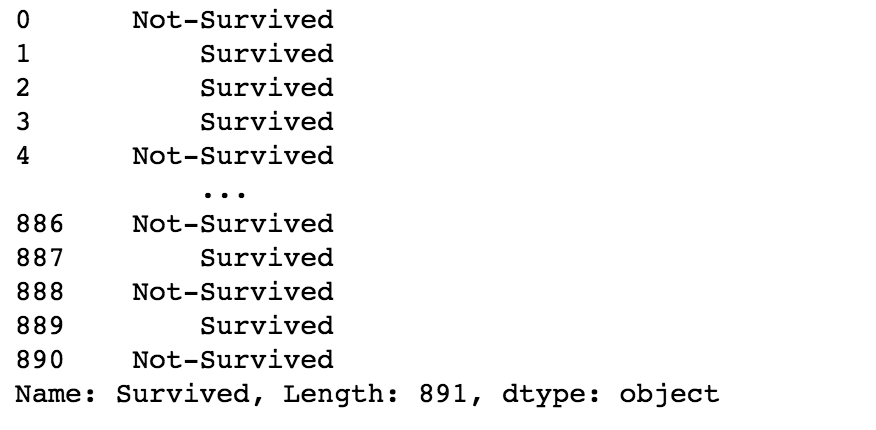
The above code maps the values 0 to ‘Not-Survived’ and 1 to ‘Survived’. You can alternatively use the following code to obtain the same results.
data['Survived'].map({1: 'Survived', 0: 'Not-Survived'})
Replacing values in a DataFrame
data['Sex'].replace(['male', 'female'], ["M", "F"])
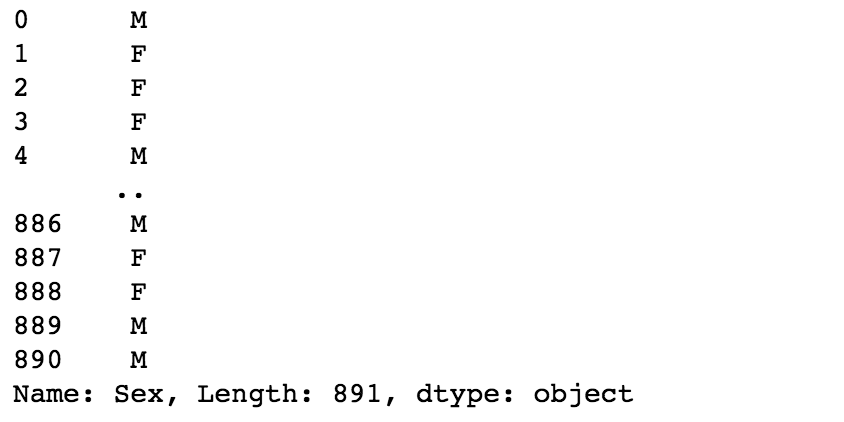
The above code replaces ‘male’ as ‘M’ and ‘female’ as ‘F’.
Save the DataFrame as a CSV file
data.to_csv('/path/to/save/the/data.csv', index=False)
The index=False argument does not save the index as a separate column in the CSV.
References
[1] Pandas Documentation
Thank you!
The media shown in this article on Deploying Machine Learning Models leveraging CherryPy and Docker are not owned by Analytics Vidhya and are used at the Author’s discretion.
Machine Learning Engineer @ Zoho Corporation