This article was published as a part of the Data Science Blogathon.
Introduction
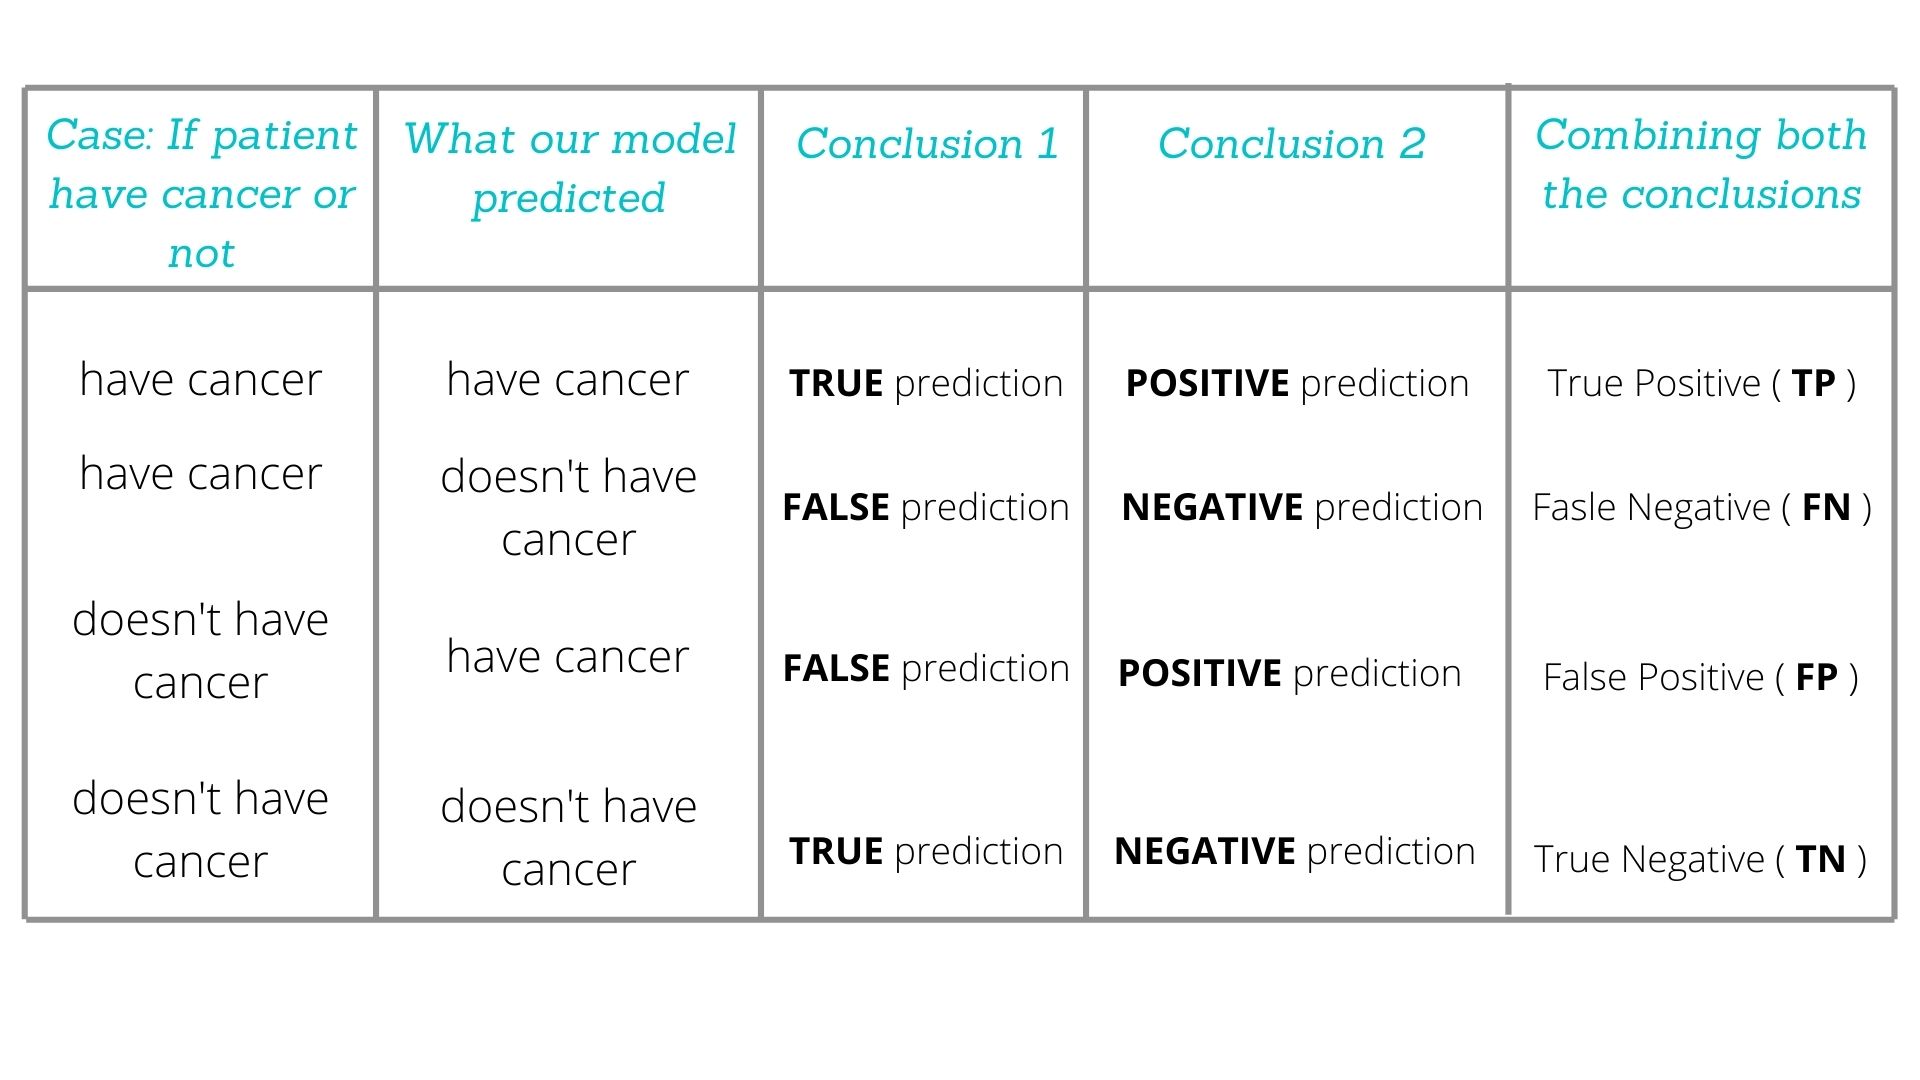
After we have trained our model and have predicted the outcomes, we need to evaluate the model’s performance. And here comes our Confusion Matrix. But before diving into what is a confusion matrix and how it evaluates the model’s performance, let’s have a look into the picture below.

What is the Confusion Matrix?
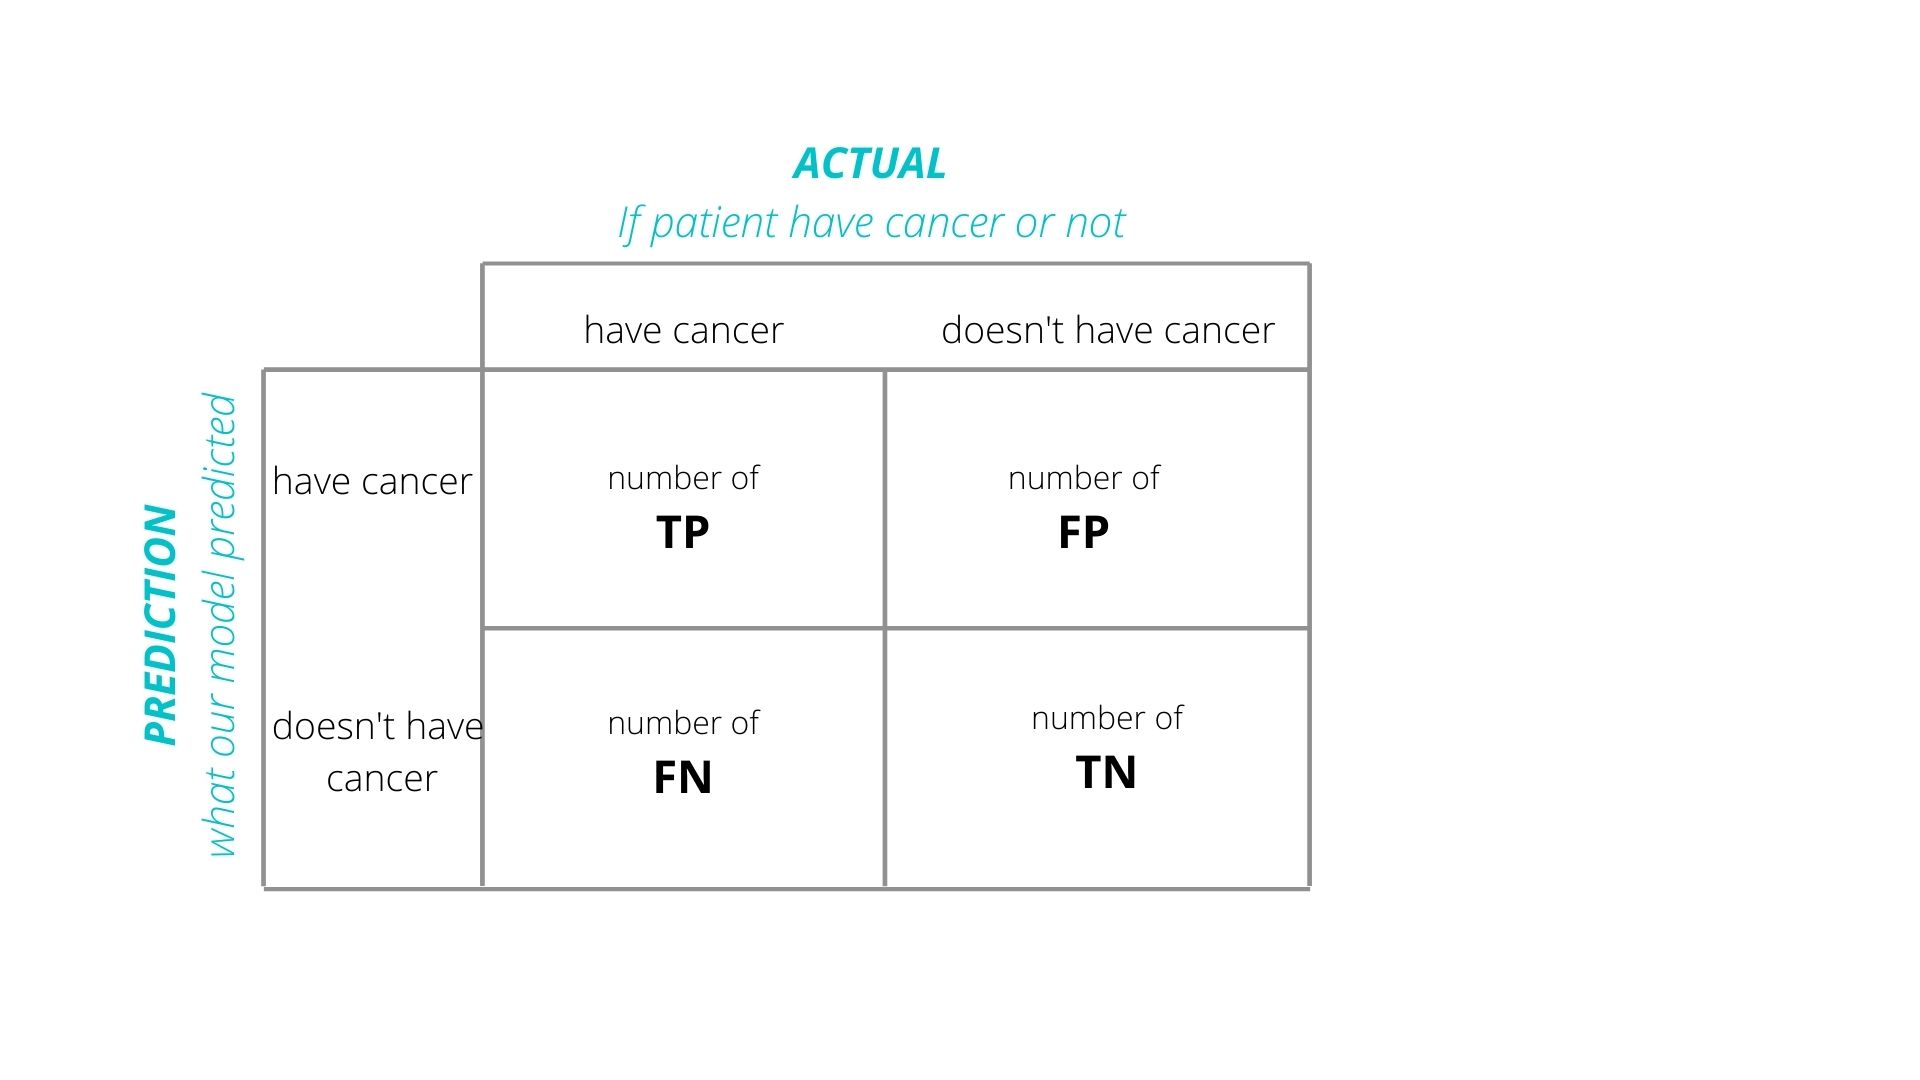
It is the 2-dimensional array representation of the above table.

The above 2-dimensional array is the Confusion Matrix which evaluates the performance of a classification model on a set of predicted values for which the true(or actual) values are known.
Terminologies
Let’s have a definition of the four important terms that define the confusion matrix-
True Positive:
Cases, where the model claims that something has happened and actually it has happened i.e patient, has cancer and the model also predicts cancer.
True Negative:
Cases, where the model claims that nothing has happened and actually nothing, has happened i.e patient doesn’t have cancer and the model also doesn’t predict cancer.
False Positive ( Type-1 error):
Cases, where the model claims that something has happened when actually it hasn’t i.e patient, doesn’t have cancer but the model predicts cancer.
False Negative (Type-2 error):
Cases, where the model claims nothing when actually something has happened i.e patient has cancer but the model doesn’t predict cancer.
How does the Confusion Matrix evaluate the model’s performance?
Now, all we need to know is how this matrix works on the dataset. For this, I’ll be using the same above case but in the form of a dataset.
| Feature 1 | Feature 2 | . . . . . | Target ( has cancer: 0, doesn’t have cancer:1) |
Prediction ( what our model predicted) |
| 1 | 1 | |||
| 0 | 1 | |||
| 1 | 1 | |||
| 1 | 0 | |||
| 0 | 0 | |||
| 0 | 0 | |||
| 1 | 1 | |||
| 1 | 1 | |||
| 0 | 0 |
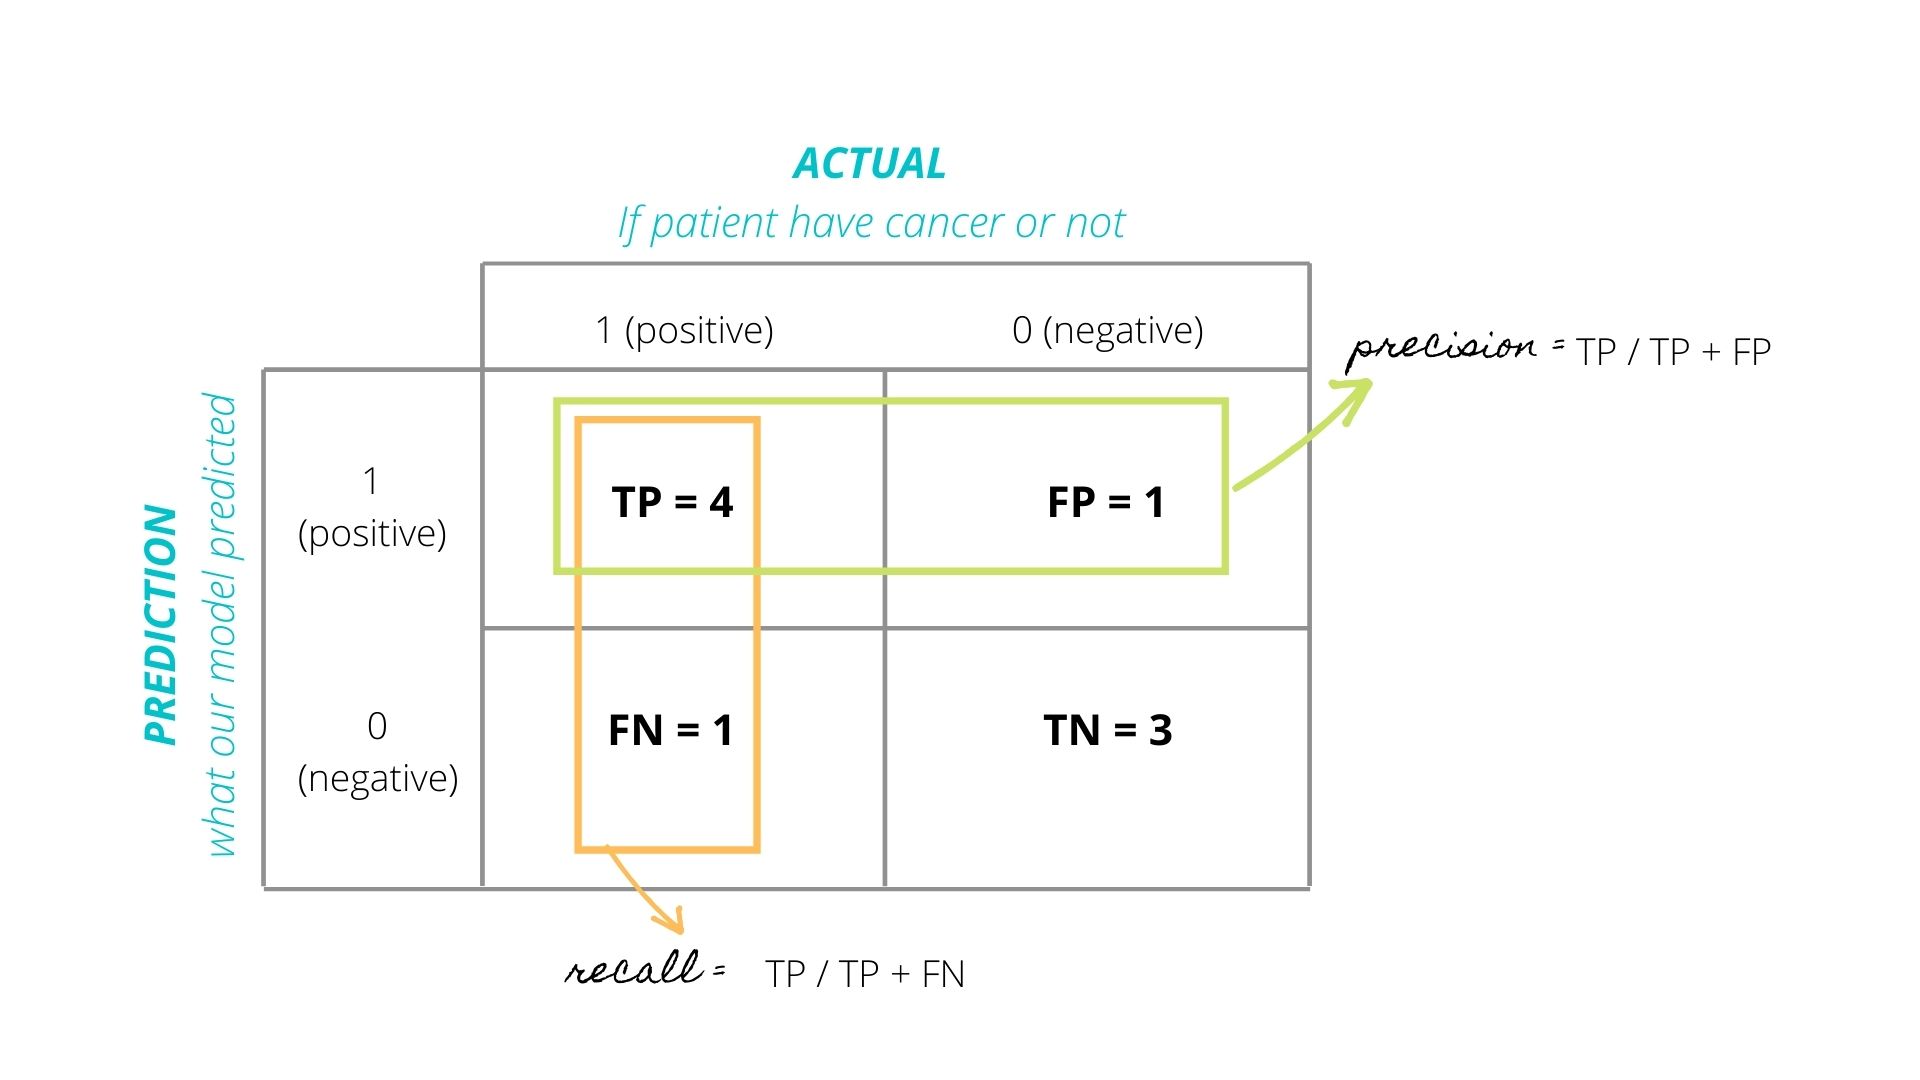
In the above classification dataset, Feature 1, Feature 2, and up to Feature n are the independent variables. For Target (dependent variable) we have assigned 1 to a positive value (i.e have cancer) and 0 to a negative value (i.e doesn’t have cancer). After we have trained our model and got our predictions and we want to evaluate the performance, this is how the confusion matrix would look like.

- TP = 4, There are four cases in the dataset where the model predicted 1 and the target was also 1
- FP = 1, There is only one case in the dataset where the model predicted 1 but the target was 0
- FN = 1, There is only one case in the dataset where the model predicted 0 but the target was 1
- TN = 3, There are three cases in the dataset where the model predicted 0 and the target was also 0
Why is the Confusion Matrix important?
The below-given metrics of confusion matrix determine how well our model performs-
- Accuracy
- Precision (Positive Prediction Value)
- Recall (True Positive Rate or Sensitivity)
- F beta Score
1. ACCURACY:
Accuracy is the number of correctly (True) predicted results out of the total.
Accuracy = (TP + TN) / (TP + TN + FP + FN)
= (4 + 3) / 9 = 0.77
Accuracy should be considered when TP and TN are more important and the dataset is balanced because in that case the model will not get baised based on the class distribution. But in real-life classification problem, imbalanced class distribution exists.
For example, we have an imbalanced test data with 900 records of positive class (1) and 100 records of negative class (0). And our model predicted all records as positive (1). In that scenario, TP will be 900 and TN will be 0. Thus, accuracy = (900 + 0) / 1000 = 90%
Therefore, we should consider Precision, Recall and F Score as a better metric to evaluate the model.
2. PRECISION:
Out of the total predicted positive values, how many were actually positive
Precision = TP / (TP + FP) = 4/5 = 0.8
When precision should be considered?
Taking a use case of Spam Detection, suppose the mail is not spam (0), but the model has predicted it as spam (1) which is FP. In this scenario, one can miss the important mail. So, here we should focus on reducing the FP and must consider precision in this case.
3. RECALL:
Out of the total actual positive values, how many were correctly predicted as positive
Recall= TP / (TP + FN) = 4/5 = 0.8
When recall should be considered?
In Cancer Detection, suppose if a person is having cancer (1), but it is not predicted (0) by the model which is FN. This could be a disaster. So, in this scenario, we should focus on reducing the FN and must consider recall in this case.
Based on the problem statement, whenever the FP is having a greater impact, go for Precision and whenever the FN is important, go for Recall
4. F beta SCORE
In some use cases, both precision and recall are important. Also, in some use cases even though precision plays an important role or recall plays is important, we should combine both to get the most accurate result.
.
Selecting beta value
F-1 Score (beta =1 )
When FP and FN both are equally important. This allows the model to consider both precision and recall equally using a single score.
F-1 Score is the Harmonic Mean of precision and recall.
Smaller beta value such as (beta = 0.5).
If the impact of FP is high. This will give more weight to precision than to recall.
Higher beta value such (beta = 2)
If the impact of FN is high. Thus, giving more weight to recall and less to precision.
Hope you found this useful and interesting.


 .
.
