This article was published as a part of the Data Science Blogathon.
Introduction
Guys! We have discussed many topics on Machine Learning, this time let’s learn about Automated Machine Learning (Auto-ML) and how it supports ML engineers to expedite the ML development and save the efforts and cost-saving to the customers.
Already we know that Machine Learning is nothing but automating the task and act smartly than the human brain and training itself and executing the task very accurate manner for real-world problems.
WHAT?
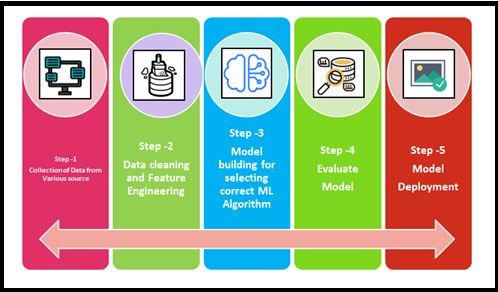
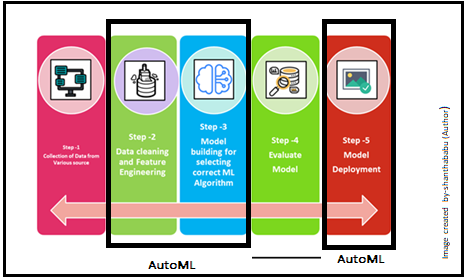
Auto-ML plays the role right from the raw dataset to the deployable machine learning model and taking care of the ML pipeline deployments, certainly, all stages. Try to remember Auto-ML is not complete automation.
There is the controversy that Auto-ML allows non-experts to make use of ML models and techniques without required knowledge. But that is not the case, I personally and strongly suggesting that if anyone having a good understanding of ML and its techniques, certainly he/she could develop the end-to-end ML model quicker and easier.
Absolutely, Auto-ML will perform without asking a huge number of questions on data preparation, cleaning, manual model selection, hyperparameters tuning, model compression parameters, and model evaluation duties, and finally models are optimized and ready for prediction. It is about making Machine Learning tasks easier to use with little reduced code.
Generally, Machine Learning model development requires extensive programming knowledge, mathematics, statistics, significant domain knowledge, and resources to produce strong models. with AutoML, you could save time and more scale-up in productivity.
But certainly, the developer should have the knowledge on all aspects to expedite the process otherwise “NO” point in bringing AutoML on the ground
Why and When?
The decision to bringing the AutoML into the specific industry for the Machine Learning implementation depends on the stakeholders and technical team concerns. Because there are valuable advantages and unavoidable disadvantages as well comes together. On top AutoML allows everyone to use ML features very quicker and faster than actual development there is no question. “Time-Saving, Organized way of execution and Speed up the development activity” are key aspects for the necessity of AutoML and really, we can say YES to AutoML.
Please keep the below points in mind about AutoML
- Supports Data Scientists: Usually, Data Scientists
need to involve an end-end life cycle, But the AutoML platform has the
capability to manage the selected ML life cycle stages and it leads us easy
for integration and enhancing productivity, obviously, AutoML is
not a replacement for Data Scientists.
- Routine job/task in ML model
life cycle: If you have automated the repetitive tasks in
the ML build ultimately allows Data Scientists to focus more on
problems and issues, bringing best practices, instead of focusing on the
models, and directly you can help cost-saving for your customers.
History of Auto-ML
Let’s discuss the history of AutoML briefly.
H2O.ai (H2O.ai)
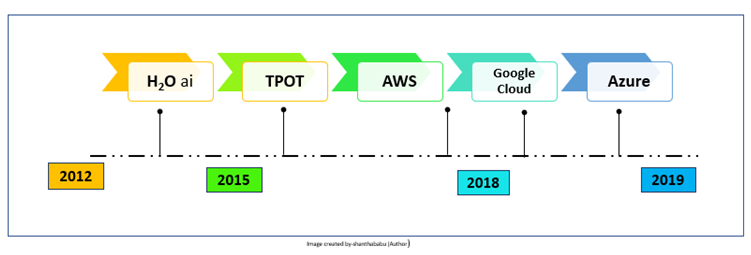
In 2012 H2O was founded and it offers an Open-source package, from 2017 they provided a commercial AutoML service called Driverless AI. It has been widely adopted in industries, including financial services and retail.
TPOT
TPOT was developed by the University of Pennsylvania and based on Python packages. It has achieved outstanding performance and accuracy range 97% -98% for the various datasets.
Google Cloud Auto-ML
Google Cloud AutoML came into the market in 2018, it is a very user-friendly interface and excellent performance.
Microsoft Azure Auto-ML
Microsoft has released Azure AutoML in 2018, It offers a transparent model selection and process. As usual Microsoft product capabilities, developers can do the demonstrate very easily and fast.
Challenges with Auto-ML
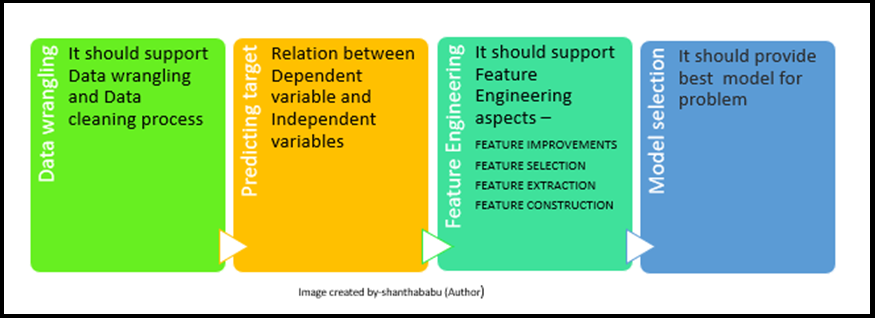
Even though AutoML supports some extent, the challenges are listed below
Auto-ML libraries
Further in detail, will discuss major AutoML libraries in the Python environment.
(A) Auto-Sklearn is an open-source library available in Python collection for AutoML implementation on top of the scikit-learn library. This is the best fit for medium/small datasets, and we could implement regression and classification problems. The main functionalities are feature engineering techniques, normalization, and dimensionality reduction.
Let’s explore autosklearn with some sample code and get the prediction.
# Importing required package
import autosklearn.regression
import sklearn.datasets
import sklearn.metrics
import pandas as pd
import numpy as np
print(" Imported required packages successfully")
Imported required packages successfully
# Loading boston dataset for analysis
X, y = sklearn.datasets.load_boston(return_X_y=True)
# Split operation for Train and Test
X_train, X_test, y_train, y_test = sklearn.model_selection.train_test_split(X, y, random_state=1)
Implementation process
#setting output file location and dataset for AutoMl analysis
automl = autosklearn.regression.AutoSklearnRegressor(
    time_left_for_this_task=120,
    per_run_time_limit=30,
    tmp_folder='/analysis/autosklearn_regression',
    output_folder='/analysis/autosklearn_regression_out',
)
automl.fit(X_train, y_train, dataset_name='boston')
Output
AutoSklearnRegressor(output_folder='/analysis/autosklearn_regression',
                     per_run_time_limit=30, time_left_for_this_task=120,
                     tmp_folder='/analysis/autosklearn_regression_out')
#print details from AutoML execution
print(automl.show_models())
Output
[(0.760000, SimpleRegressionPipeline({'data_preprocessing:categorical_transformer:categorical_encoding:__choice__': 'one_hot_encoding', 'data_preprocessing:categorical_transformer:category_coalescence:__choice__': 'minority_coalescer', 'data_preprocessing:numerical_transformer:imputation:strategy': 'mean', 'data_preprocessing:numerical_transformer:rescaling:__choice__': 'standardize', 'feature_preprocessor:__choice__': 'no_preprocessing', 'regressor:__choice__': 'random_forest', 'data_preprocessing:categorical_transformer:category_coalescence:minority_coalescer:minimum_fraction': 0.01, 'regressor:random_forest:bootstrap': 'True', 'regressor:random_forest:criterion': 'mse', 'regressor:random_forest:max_depth': 'None', 'regressor:random_forest:max_features': 1.0, 'regressor:random_forest:max_leaf_nodes': 'None', 'regressor:random_forest:min_impurity_decrease': 0.0, 'regressor:random_forest:min_samples_leaf': 1, 'regressor:random_forest:min_samples_split': 2, 'regressor:random_forest:min_weight_fraction_leaf': 0.0},
dataset_properties={
  'task': 4,
  'sparse': False,
  'multioutput': False,
  'target_type': 'regression',
  'signed': False})),
(0.220000, SimpleRegressionPipeline({'data_preprocessing:categorical_transformer:categorical_encoding:__choice__': 'one_hot_encoding', 'data_preprocessing:categorical_transformer:category_coalescence:__choice__': 'no_coalescense', 'data_preprocessing:numerical_transformer:imputation:strategy': 'most_frequent', 'data_preprocessing:numerical_transformer:rescaling:__choice__': 'standardize', 'feature_preprocessor:__choice__': 'polynomial', 'regressor:__choice__': 'ard_regression', 'feature_preprocessor:polynomial:degree': 2, 'feature_preprocessor:polynomial:include_bias': 'True', 'feature_preprocessor:polynomial:interaction_only': 'False', 'regressor:ard_regression:alpha_1': 0.0003701926442639788, 'regressor:ard_regression:alpha_2': 2.2118001735899097e-07, 'regressor:ard_regression:fit_intercept': 'True', 'regressor:ard_regression:lambda_1': 1.2037591637980971e-06, 'regressor:ard_regression:lambda_2': 4.358378124977852e-09, 'regressor:ard_regression:n_iter': 300, 'regressor:ard_regression:threshold_lambda': 1136.5286041327277, 'regressor:ard_regression:tol': 0.021944240404849075},
dataset_properties={
  'task': 4,
  'sparse': False,
  'multioutput': False,
  'target_type': 'regression',
  'signed': False})),
(0.020000, SimpleRegressionPipeline({'data_preprocessing:categorical_transformer:categorical_encoding:__choice__': 'one_hot_encoding', 'data_preprocessing:categorical_transformer:category_coalescence:__choice__': 'minority_coalescer', 'data_preprocessing:numerical_transformer:imputation:strategy': 'most_frequent', 'data_preprocessing:numerical_transformer:rescaling:__choice__': 'robust_scaler', 'feature_preprocessor:__choice__': 'select_rates_regression', 'regressor:__choice__': 'extra_trees', 'data_preprocessing:categorical_transformer:category_coalescence:minority_coalescer:minimum_fraction': 0.019566163649872924, 'data_preprocessing:numerical_transformer:rescaling:robust_scaler:q_max': 0.7200608810425068, 'data_preprocessing:numerical_transformer:rescaling:robust_scaler:q_min': 0.22968043330398744, 'feature_preprocessor:select_rates_regression:alpha': 0.18539282936320728, 'feature_preprocessor:select_rates_regression:mode': 'fwe', 'feature_preprocessor:select_rates_regression:score_func': 'f_regression', 'regressor:extra_trees:bootstrap': 'False', 'regressor:extra_trees:criterion': 'mae', 'regressor:extra_trees:max_depth': 'None', 'regressor:extra_trees:max_features': 0.9029989558220115, 'regressor:extra_trees:max_leaf_nodes': 'None', 'regressor:extra_trees:min_impurity_decrease': 0.0, 'regressor:extra_trees:min_samples_leaf': 1, 'regressor:extra_trees:min_samples_split': 2, 'regressor:extra_trees:min_weight_fraction_leaf': 0.0},
dataset_properties={
  'task': 4,
  'sparse': False,
  'multioutput': False,
  'target_type': 'regression',
  'signed': False})),
]
#extracting predicted value from AutoML
predictions = automl.predict(X_test)
print("R2 score:", sklearn.metrics.r2_score(y_test, predictions))
Output
R2 score: 0.9018056173149241
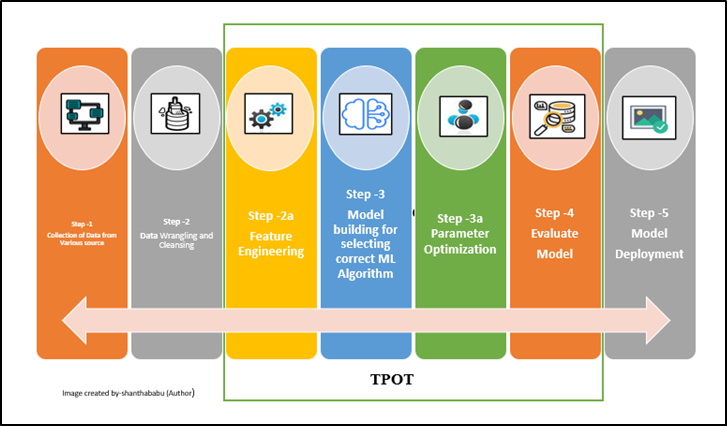
(B) TPOT is also an open-source AutoML library
available in Python. The data flow architecture has been clearly explained, where TPOT is focusing
on, It expects cleaned and fine data set for Feature Engineering, Model Selection
and Hyperparameter optimization
process, So here data wrangling and cleansing should be taken care of by the data scientist.[No other go 🙂 ]
Do some exercise
# Load the data into dataframe
titanic = pd.read_csv('titanic.csv')
titanic.head(5)
Image-7a(Datafream-titanic)
# Load the data into dataframe
titanic.dtypes
Output
PassengerId      int64
class            int64
Pclass           int64
Name            object
Sex             object
Age            float64
SibSp            int64
Parch            int64
Ticket          object
Fare           float64
Cabin           object
Embarked        object
dtype: object
Quick EDA
#Grouping the date based on sex and survived counts
titanic.groupby('sex').survived.value_counts()
sex     survived
female  1           233
        0            81
male    0           468
        1           109
Name: survived, dtype: int64
Let’s explore TPOT options
- Dividing our training data into training and validation sets.
- TPOT will take care of The model selection and tuning.
training_indices,validation_indices=training_indices,testing_indices = train_test_split(titanic.index,
stratify=titanic_class,train_size=0.75, test_size=0.25)
training_indices.size, validation_indices.size
Output
(668, 223)
Now will call the fit, score, and export functions on our training dataset.
tpot = TPOTClassifier(verbosity=2, max_time_mins=2, max_eval_time_mins=0.04, population_size=40)
tpot.fit(titanic_new[training_indices], titanic_class[training_indices])
Output
Warning: xgboost.XGBClassifier is not available and will not be used by TPOT.
Optimization Progress: 100%|██████████| 80/80 [00:12<00:00, 6.43pipeline/s]
Generation 1 - Current best internal CV score: 0.8203972618112445
Optimization Progress: 100%|██████████| 120/120 [00:19<00:00, 5.50pipeline/s]
Generation 2 - Current best internal CV score: 0.8203972618112445
Optimization Progress: 100%|██████████| 160/160 [00:32<00:00, 2.99pipeline/s]
Generation 3 - Current best internal CV score: 0.8203972618112445
Optimization Progress: 100%|██████████| 200/200 [00:43<00:00, 6.08pipeline/s]
Generation 4 - Current best internal CV score: 0.8203972618112445
Optimization Progress: 100%|██████████| 240/240 [00:52<00:00, 4.20pipeline/s]
Generation 5 - Current best internal CV score: 0.8203972618112445
Optimization Progress: 100%|██████████| 280/280 [01:03<00:00, 3.62pipeline/s]
Generation 6 - Current best internal CV score: 0.8219341887055946
Optimization Progress: 100%|██████████| 320/320 [01:15<00:00, 3.21pipeline/s]
Generation 7 - Current best internal CV score: 0.8249418737556994
Optimization Progress: 100%|██████████| 360/360 [01:26<00:00, 3.95pipeline/s]
Generation 8 - Current best internal CV score: 0.8249418737556994
Optimization Progress: 100%|██████████| 400/400 [01:38<00:00, 4.84pipeline/s]
Generation 9 - Current best internal CV score: 0.8249418737556994
Optimization Progress: 100%|██████████| 440/440 [01:48<00:00, 3.66pipeline/s]
Generation 10 - Current best internal CV score: 0.8249418737556994
Optimization Progress: 100%|██████████| 480/480 [02:51<00:00, 2.06s/pipeline]
Generation 11 - Current best internal CV score: 0.8249418737556994
9, 2.05s/pipeline]
Let’s find the score
tpot.score(titanic_new[validation_indices], titanic.loc[validation_indices, 'class'].values)
Output
0.8340807174843700
(C) H2O’s AutoML is developed by H2O, As mentioned earlier in the AutoML history note. This is not like TPOT and it helps to pre-process which includes imputation, encoding, handling missing values, and model selection and hyperparameter tuning. The good thing here is, it provides deployable code for the team to deploy quickly.
(D) HyperOpt is for Bayesian optimization purposes, it helps us for optimizing models with hundreds of parameters in the given dataset. As the name implies that this is explicitly used to optimize the pipelines. To simplify the usage of this library has been integrated with sklearn and available in the name of HyperOpt-sklearn.
Will do demonstration with the iris dataset
# Import required libraries
import numpy as np
import skdata.iris.view
import hyperopt.tpe
import hpsklearn
import hpsklearn.demo_support
import time
print("Imported required libraries successfully")
Output
Imported required libraries successfully
# Data processing for training and test
data_view = skdata.iris.view.KfoldClassification(3)
attributs = 'sepal_length', 'sepal_width','petal_length', 'petal_width'
labels = 'virginica','setosa', 'versicolor'
X_all = np.asarray([map(d.__getitem__, attributs) for d in data_view.dataset.meta])
y_all = np.asarray([labels.index(d['name']) for d in data_view.dataset.meta])
idx_all = np.random.RandomState(1).permutation(len(y_all))
idx_train = idx_all[:int(.6 * len(y_all))]
idx_test = idx_all[int(.6 * len(y_all)):]
X_train = X_all[idx_train]
y_train = y_all[idx_train]
X_test = X_all[idx_test]
y_test = y_all[idx_test]
Defining estimator using HPsklearn
estimator = hpsklearn.HyperoptEstimator(
    preprocessing=hpsklearn.components.any_preprocessing('ppl'),
    classifier=hpsklearn.components.any_classifier('clf'),
    algo=hyperopt.tpe.suggest,
    trial_timeout=18.0, # seconds
    max_evals=18,
    )
Picking the modle
for ppl in estimator._best_preprocs:
    print ppl
    print("##########################################")
    print 'Classifier:n', estimator._best_learner
    test_predictions = estimator.predict(X_test)
    acc_in_percent = 100 * np.mean(test_predictions == y_test)
    print("##############################################")
    print ("Prediction accuracy is %.1f%%" % acc_in_percent)
Output
PCA(copy=True, n_components=3, whiten=False)
##############################################
Classifier:
KNeighborsClassifier(algorithm=auto, leaf_size=72, metric=euclidean,
n_neighbors=29, p=2, weights=uniform)
##############################################
Prediction accuracy is 96.7%
(E) MLBox is a much comfortable AutoML library and functionalities include, Data pre-processing, Imputation, Outliers detection, Feature selection, Model selection.
(F) AutoKeras libraries specifically for automating the Deep Learning and Neural Networks models. Will create a separate article for this, because of its complexity, similarly AutoGluon library build for Deep Learning.
Comparison Study of AutoML libraries
The below table would help you all to understand the various open AutoML libraries and their capabilities.
I trust this article would help you all to understand what, why, and why AutoML and power in Data Science and Machine Learning space. I will get back to you with my favorite Microsoft Azure Machine Learning Services ( (AutoML) and components with neat workflow.
Until then bye! See you soon – Shanthababu
The media shown in this article are not owned by Analytics Vidhya and is used at the Author’s discretion.


