Introduction
Anyone who has participated in machine learning hackathons and competitions can attest to how crucial feature engineering can be. It is often the difference between getting into the top 10 of the leaderboard and finishing outside the top 50!
I have been a huge advocate of feature engineering ever since I realized it’s immense potential. But it can be a slow and arduous process when done manually. I have to spend time brainstorming over what features to come up, and analyze their usability them from different angles. Now, this entire FE process can be automated and I’m going to show you how in this article.

Source: VentureBeat
We will be using the Python feature engineering library called Featuretools to do this. But before we get into that, we will first look at the basic building blocks of FE, understand them with intuitive examples, and then finally dive into the awesome world of automated feature engineering using the BigMart Sales dataset.
Table of Contents
- What is a feature?
- What is Feature Engineering?
- Why is Feature Engineering required?
- Automating Feature Engineering
- Introduction to Featuretools
- Implementation of Featuretools
- Featuretools Interpretability
1. What is a feature?
In the context of machine learning, a feature can be described as a characteristic, or a set of characteristics, that explains the occurrence of a phenomenon. When these characteristics are converted into some measurable form, they are called features.
For example, assume you have a list of students. This list contains the name of each student, number of hours they studied, their IQ, and their total marks in the previous examinations. Now you are given information about a new student— the number of hours he/she studied and his IQ, but his/her marks are missing. You have to estimate his/her probable marks.
Here, you’d use IQ and study_hours to build a predictive model to estimate these missing marks. So, IQ and study_hours are called the features for this model.
2. What is Feature Engineering?
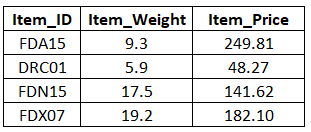
Feature Engineering can simply be defined as the process of creating new features from the existing features in a dataset. Let’s consider a sample data that has details about a few items, such as their weight and price.
Now, to create a new feature we can use Item_Weight and Item_Price. So, let’s create a feature called Price_per_Weight. It is nothing but the price of the item divided by the weight of the item. This process is called feature engineering.
This was just a simple example to create a new feature from existing ones, but in practice, when we have quite a lot of features, feature engineering can become quite complex and cumbersome.
Let’s take another example. In the popular Titanic dataset, there is a passenger name feature and below are some of the names in the dataset:
- Montvila, Rev. Juozas
- Graham, Miss. Margaret Edith
- Johnston, Miss. Catherine Helen “Carrie”
- Behr, Mr. Karl Howell
- Dooley, Mr. Patrick
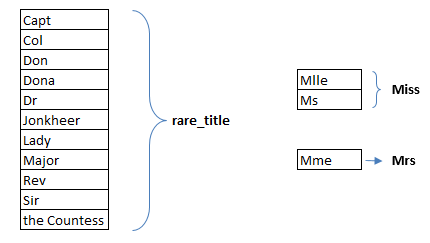
These names can actually be broken down into additional meaningful features. For example, we can extract and group similar titles into single categories. Let’s have a look at the unique number of titles in the passenger names.
It turns out that titles like ‘Dona’, ‘Lady’, ‘the Countess’, ‘Capt’, ‘Col’, ‘Don’, ‘Dr’, ‘Major’, ‘Rev’, ‘Sir’, and ‘Jonkheer’ are quite rare and can be put under a single label. Let’s call it rare_title. Apart from this, the titles ‘Mlle’ and ‘Ms’ can be placed under ‘Miss’, and ‘Mme’ can be replaced with ‘Mrs’.
Hence, the new title feature would have only 5 unique values as shown below:
So, this is how we can extract useful information with the help of feature engineering, even from features like passenger names which initially seemed fairly pointless.
3. Why is Feature Engineering required?
The performance of a predictive model is heavily dependent on the quality of the features in the dataset used to train that model. If you are able to create new features which help in providing more information to the model about the target variable, it’s performance will go up. Hence, when we don’t have enough quality features in our dataset, we have to lean on feature engineering.
In one of the most popular Kaggle competitions, Bike Sharing Demand Prediction, the participants are asked to forecast the rental demand in Washington, D.C based on historical usage patterns in relation with weather, time and other data.
As explained in this article, smart feature engineering was instrumental in securing a place in the top 5 percentile of the leaderboard. Some of the features created are given below:
- Hour Bins: A new feature was created by binning the hour feature with the help of a decision tree
- Temp Bins: Similarly, a binned feature for the temperature variable
- Year Bins: 8 quarterly bins were created for a period of 2 years
- Day Type: Days were categorized as “weekday”, “weekend” or “holiday”
Creating such features is no cakewalk – it takes a great deal of brainstorming and extensive data exploration. Not everyone is good at feature engineering because it is not something that you can learn by reading books or watching videos. This is why feature engineering is also called an art. If you are good at it, then you have a major edge over the competition. Quite like Roger Federer, the master of feature engineering when it comes to Tennis shots.
4. Automating Feature Engineering
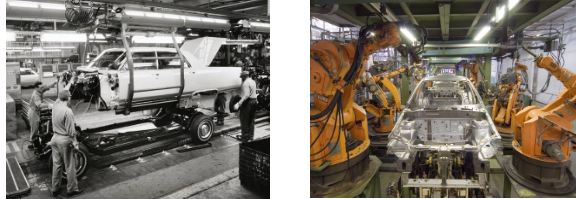
Analyze the two images shown above. The left one shows a car being assembled by a group of men during early 20th century, and the right picture shows robots doing the same job in today’s world. Automating any process has the potential to make it much more efficient and cost-effective. For similar reasons, feature engineering can, and has been, automated in machine learning.
Building machine learning models can often be a painstaking and tedious process. It involves many steps so if we are able to automate a certain percentage of feature engineering tasks, then the data scientists or the domain experts can focus on other aspects of the model. Sounds too good to be true, right?
Now that we have understood that automating feature engineering is the need of the hour, the next question to ask is – how is it going to happen? Well, we have a great tool to address this issue and it’s called Featuretools.
5. Introduction to Featuretools
Featuretools is an open source library for performing automated feature engineering. It is a great tool designed to fast-forward the feature generation process, thereby giving more time to focus on other aspects of machine learning model building. In other words, it makes your data “machine learning ready”.
Before taking Featuretools for a spin, there are three major components of the package that we should be aware of:
- Entities
- Deep Feature Synthesis (DFS)
- Feature primitives
a) An Entity can be considered as a representation of a Pandas DataFrame. A collection of multiple entities is called an Entityset.
b) Deep Feature Synthesis (DFS) has got nothing to do with deep learning. Don’t worry. DFS is actually a Feature Engineering method and is the backbone of Featuretools. It enables the creation of new features from single, as well as multiple dataframes.
c) DFS create features by applying Feature primitives to the Entity-relationships in an EntitySet. These primitives are the often-used methods to generate features manually. For example, the primitive “mean” would find the mean of a variable at an aggregated level.
The best way to understand and become comfortable with Featuretools is by applying it on a dataset. So, we will use the dataset from our BigMart Sales practice problem in the next section to solidify our concepts.
6. Implementation of Featuretools
The objective of the BigMart Sales challenge is to build a predictive model to estimate the sales of each product at a particular store. This would help the decision makers at BigMart to find out the properties of any product or store, which play a key role in increasing the overall sales. Note that there are 1559 products across 10 stores in the given dataset.
The below table shows the features provided in our data:
| Variable | Description |
|---|---|
| Item_Identifier | Unique product ID |
| Item_Weight | Weight of product |
| Item_Fat_Content | Whether the product is low fat or not |
| Item_Visibility | The % of total display area of all products in a store allocated to the particular product |
| Item_Type | The category to which the product belongs |
| Item_MRP | Maximum Retail Price (list price) of the product |
| Outlet_Identifier | Unique store ID |
| Outlet_Establishment_Year | The year in which store was established |
| Outlet_Size | The size of the store in terms of ground area covered |
| Outlet_Location_Type | The type of city in which the store is located |
| Outlet_Type | Whether the outlet is just a grocery store or some sort of supermarket |
| Item_Outlet_Sales | Sales of the product in the particulat store. This is the outcome variable to be predicted. |
You can download the data from here.
6.1. Installation
Featuretools is available for Python 2.7, 3.5, and 3.6. You can easily install Featuretools using pip.
python -m pip install featuretools
6.2. Loading required Libraries and Data
Python Code:
6.3. Data Preparation
To start off, we’ll just store the target Item_Outlet_Sales in a variable called sales and id variables in test_Item_Identifier and test_Outlet_Identifier.
# saving identifiers
test_Item_Identifier = test['Item_Identifier']
test_Outlet_Identifier = test['Outlet_Identifier']
sales = train['Item_Outlet_Sales']
train.drop(['Item_Outlet_Sales'], axis=1, inplace=True)
Then we will combine the train and test set as it saves us the trouble of performing the same step(s) twice.
combi = train.append(test, ignore_index=True)
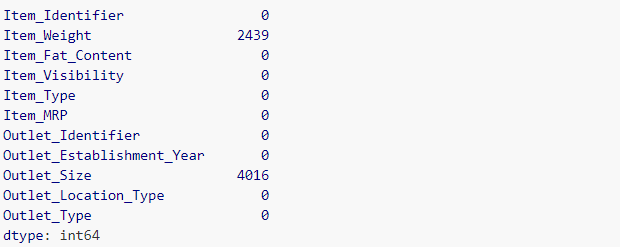
Let’s check the missing values in the dataset.
combi.isnull().sum()
Quite a lot of missing values in the Item_Weight and Outlet_size variables. Let’s quickly deal with them:
# imputing missing data
combi['Item_Weight'].fillna(combi['Item_Weight'].mean(), inplace = True)
combi['Outlet_Size'].fillna("missing", inplace = True)
6.4. Data Preprocessing
I will not do an extensive preprocessing operation since the objective of this article is to get you started with Featuretools.
combi['Item_Fat_Content'].value_counts()
It seems Item_Fat_Content contains only two categories, i.e., “Low Fat” and “Regular” – the rest of them we will consider redundant. So, let’s convert it into a binary variable.
# dictionary to replace the categories
fat_content_dict = {'Low Fat':0, 'Regular':1, 'LF':0, 'reg':1, 'low fat':0}

combi['Item_Fat_Content'] = combi['Item_Fat_Content'].replace(fat_content_dict, regex=True)
6.5. Feature Engineering using Featuretools
Now we can start using Featuretools to perform automated feature engineering! It is necessary to have a unique identifier feature in the dataset (our dataset doesn’t have any right now). So, we will create one unique ID for our combined dataset. If you notice, we have two IDs in our data—one for the item and another for the outlet. So, simply concatenating both will give us a unique ID.
combi['id'] = combi['Item_Identifier'] + combi['Outlet_Identifier']
combi.drop(['Item_Identifier'], axis=1, inplace=True)
Please note that I have dropped the feature Item_Identifier as it is no longer required. However, I have retained the feature Outlet_Identifier because I plan to use it later.
Now before proceeding, we will have to create an EntitySet. An EntitySet is a structure that contains multiple dataframes and relationships between them. So, let’s create an EntitySet and add the dataframe combination to it.
# creating and entity set 'es'
es = ft.EntitySet(id = 'sales')

# adding a dataframe
es.entity_from_dataframe(entity_id = 'bigmart', dataframe = combi, index = 'id')
Our data contains information at two levels—item level and outlet level. Featuretools offers a functionality to split a dataset into multiple tables. We have created a new table ‘outlet’ from the BigMart table based on the outlet ID Outlet_Identifier.
es.normalize_entity(base_entity_id='bigmart', new_entity_id='outlet', index = 'Outlet_Identifier',
additional_variables = ['Outlet_Establishment_Year', 'Outlet_Size', 'Outlet_Location_Type', 'Outlet_Type'])
Let’s check the summary of our EntitySet.
print(es)
As you can see above, it contains two entities – bigmart and outlet. There is also a relationship formed between the two tables, connected by Outlet_Identifier. This relationship will play a key role in the generation of new features.
Now we will use Deep Feature Synthesis to create new features automatically. Recall that DFS uses Feature Primitives to create features using multiple tables present in the EntitySet.
feature_matrix, feature_names = ft.dfs(entityset=es,
target_entity = 'bigmart',
max_depth = 2,
verbose = 1,
n_jobs = 3)
target_entity is nothing but the entity ID for which we wish to create new features (in this case, it is the entity ‘bigmart’). The parameter max_depth controls the complexity of the features being generated by stacking the primitives. The parameter n_jobs helps in parallel feature computation by using multiple cores.
That’s all you have to do with Featuretools. It has generated a bunch of new features on its own.
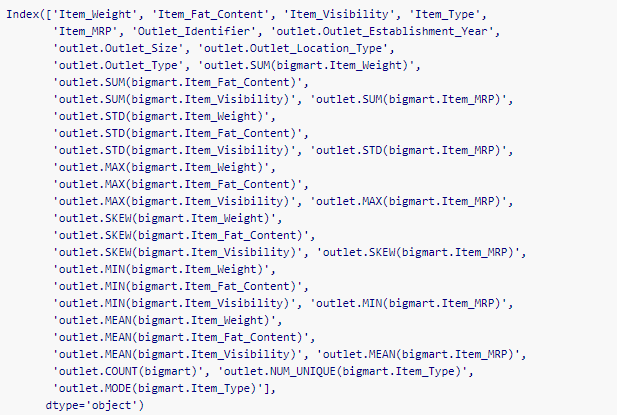
Let’s have a look at these newly created features.
feature_matrix.columns
DFS has created 29 new features in such a quick time. It is phenomenal as it would have taken much longer to do it manually. If you have datasets with multiple interrelated tables, Featuretools would still work. In that case, you wouldn’t have to normalize a table as multiple tables will already be available.
Let’s print the first few rows of feature_matrix.
feature_matrix.head()
There is one issue with this dataframe – it is not sorted properly. We will have to sort it based on the id variable from the combi dataframe.
feature_matrix = feature_matrix.reindex(index=combi['id'])
feature_matrix = feature_matrix.reset_index()
Now the dataframe feature_matrix is in proper order.
6.6. Model Building
It is time to check how useful these generated features actually are. We will use them to build a model and predict Item_Outlet_Sales. Since our final data (feature_matrix) has many categorical features, I decided to use the CatBoost algorithm. It can use categorical features directly and is scalable in nature. You can refer to this article to read more about CatBoost.
from catboost import CatBoostRegressor
CatBoost requires all the categorical variables to be in the string format. So, we will convert the categorical variables in our data to string first:
categorical_features = np.where(feature_matrix.dtypes == 'object')[0]

for i in categorical_features:
    feature_matrix.iloc[:,i] = feature_matrix.iloc[:,i].astype('str')
Let’s split feature_matrix back into train and test sets.
feature_matrix.drop(['id'], axis=1, inplace=True)
train = feature_matrix[:8523]
test = feature_matrix[8523:]
# removing uneccesary variables
train.drop(['Outlet_Identifier'], axis=1, inplace=True)
test.drop(['Outlet_Identifier'], axis=1, inplace=True)
# identifying categorical features
categorical_features = np.where(train.dtypes == 'object')[0]
Split the train data into training and validation set to check the model’s performance locally.
from sklearn.model_selection import train_test_split

# splitting train data into training and validation set
xtrain, xvalid, ytrain, yvalid = train_test_split(train, sales, test_size=0.25, random_state=11)
Finally, we can now train our model. The evaluation metric we will use is RMSE (Root Mean Squared Error).
model_cat = CatBoostRegressor(iterations=100, learning_rate=0.3, depth=6, eval_metric='RMSE', random_seed=7)

# training model
model_cat.fit(xtrain, ytrain, cat_features=categorical_features, use_best_model=True)
# validation score
model_cat.score(xvalid, yvalid)
1091.244
The RMSE score on the validation set is ~1092.24.
The same model got a score of 1155.12 on the public leaderboard. Without any feature engineering, the scores were ~1103 and ~1183 on the validation set and the public leaderboard, respectively. Hence, the features created by Featuretools are not just random features, they are valuable and useful. Most importantly, the amount of time it saves in feature engineering is incredible.
7. Featuretools Interpretability
Making our data science solutions interpretable is a very important aspect of performing machine learning. Features generated by Featuretools can be easily explained even to a non-technical person because they are based on the primitives, which are easy to understand.
For example, the features outlet.SUM(bigmart.Item_Weight) and outlet.STD(bigmart.Item_MRP) mean outlet-level sum of weight of the items and standard deviation of the cost of the items, respectively.
This makes it possible for those people who are not machine learning experts, to contribute as well in terms of their domain expertise.
End Notes
The featuretools package is truly a game-changer in machine learning. While it’s applications are understandably still limited in industry use cases, it has quickly become ultra popular in hackathons and ML competitions. The amount of time it saves, and the usefulness of feature it generates, has truly won me over.
Try it out next time you work on any dataset and let me know how it went in the comments section!


